Facebook is one of the most successful social media companies. Since 2004, it has been the leading social media network, with billions of monthly active users, superseding TikTok and other virals.
To help you understand Facebook's dominance, we created a list of essential Facebook statistics for 2024. The list is continuously updated using Meta's official reports and reliable industry studies and surveys.
Top Statistics
The most important statistics you need to know about Facebook are:
- Facebook has more than 3 billion monthly active users. This number is increasing at a rate of 6% year over year.
- The country that uses Facebook the most is India, followed by the United States.
- It is estimated that more than 250 million Americans have a Facebook account.
- The average time a person spends on Facebook monthly is 19.6 hours.
Facebook Users
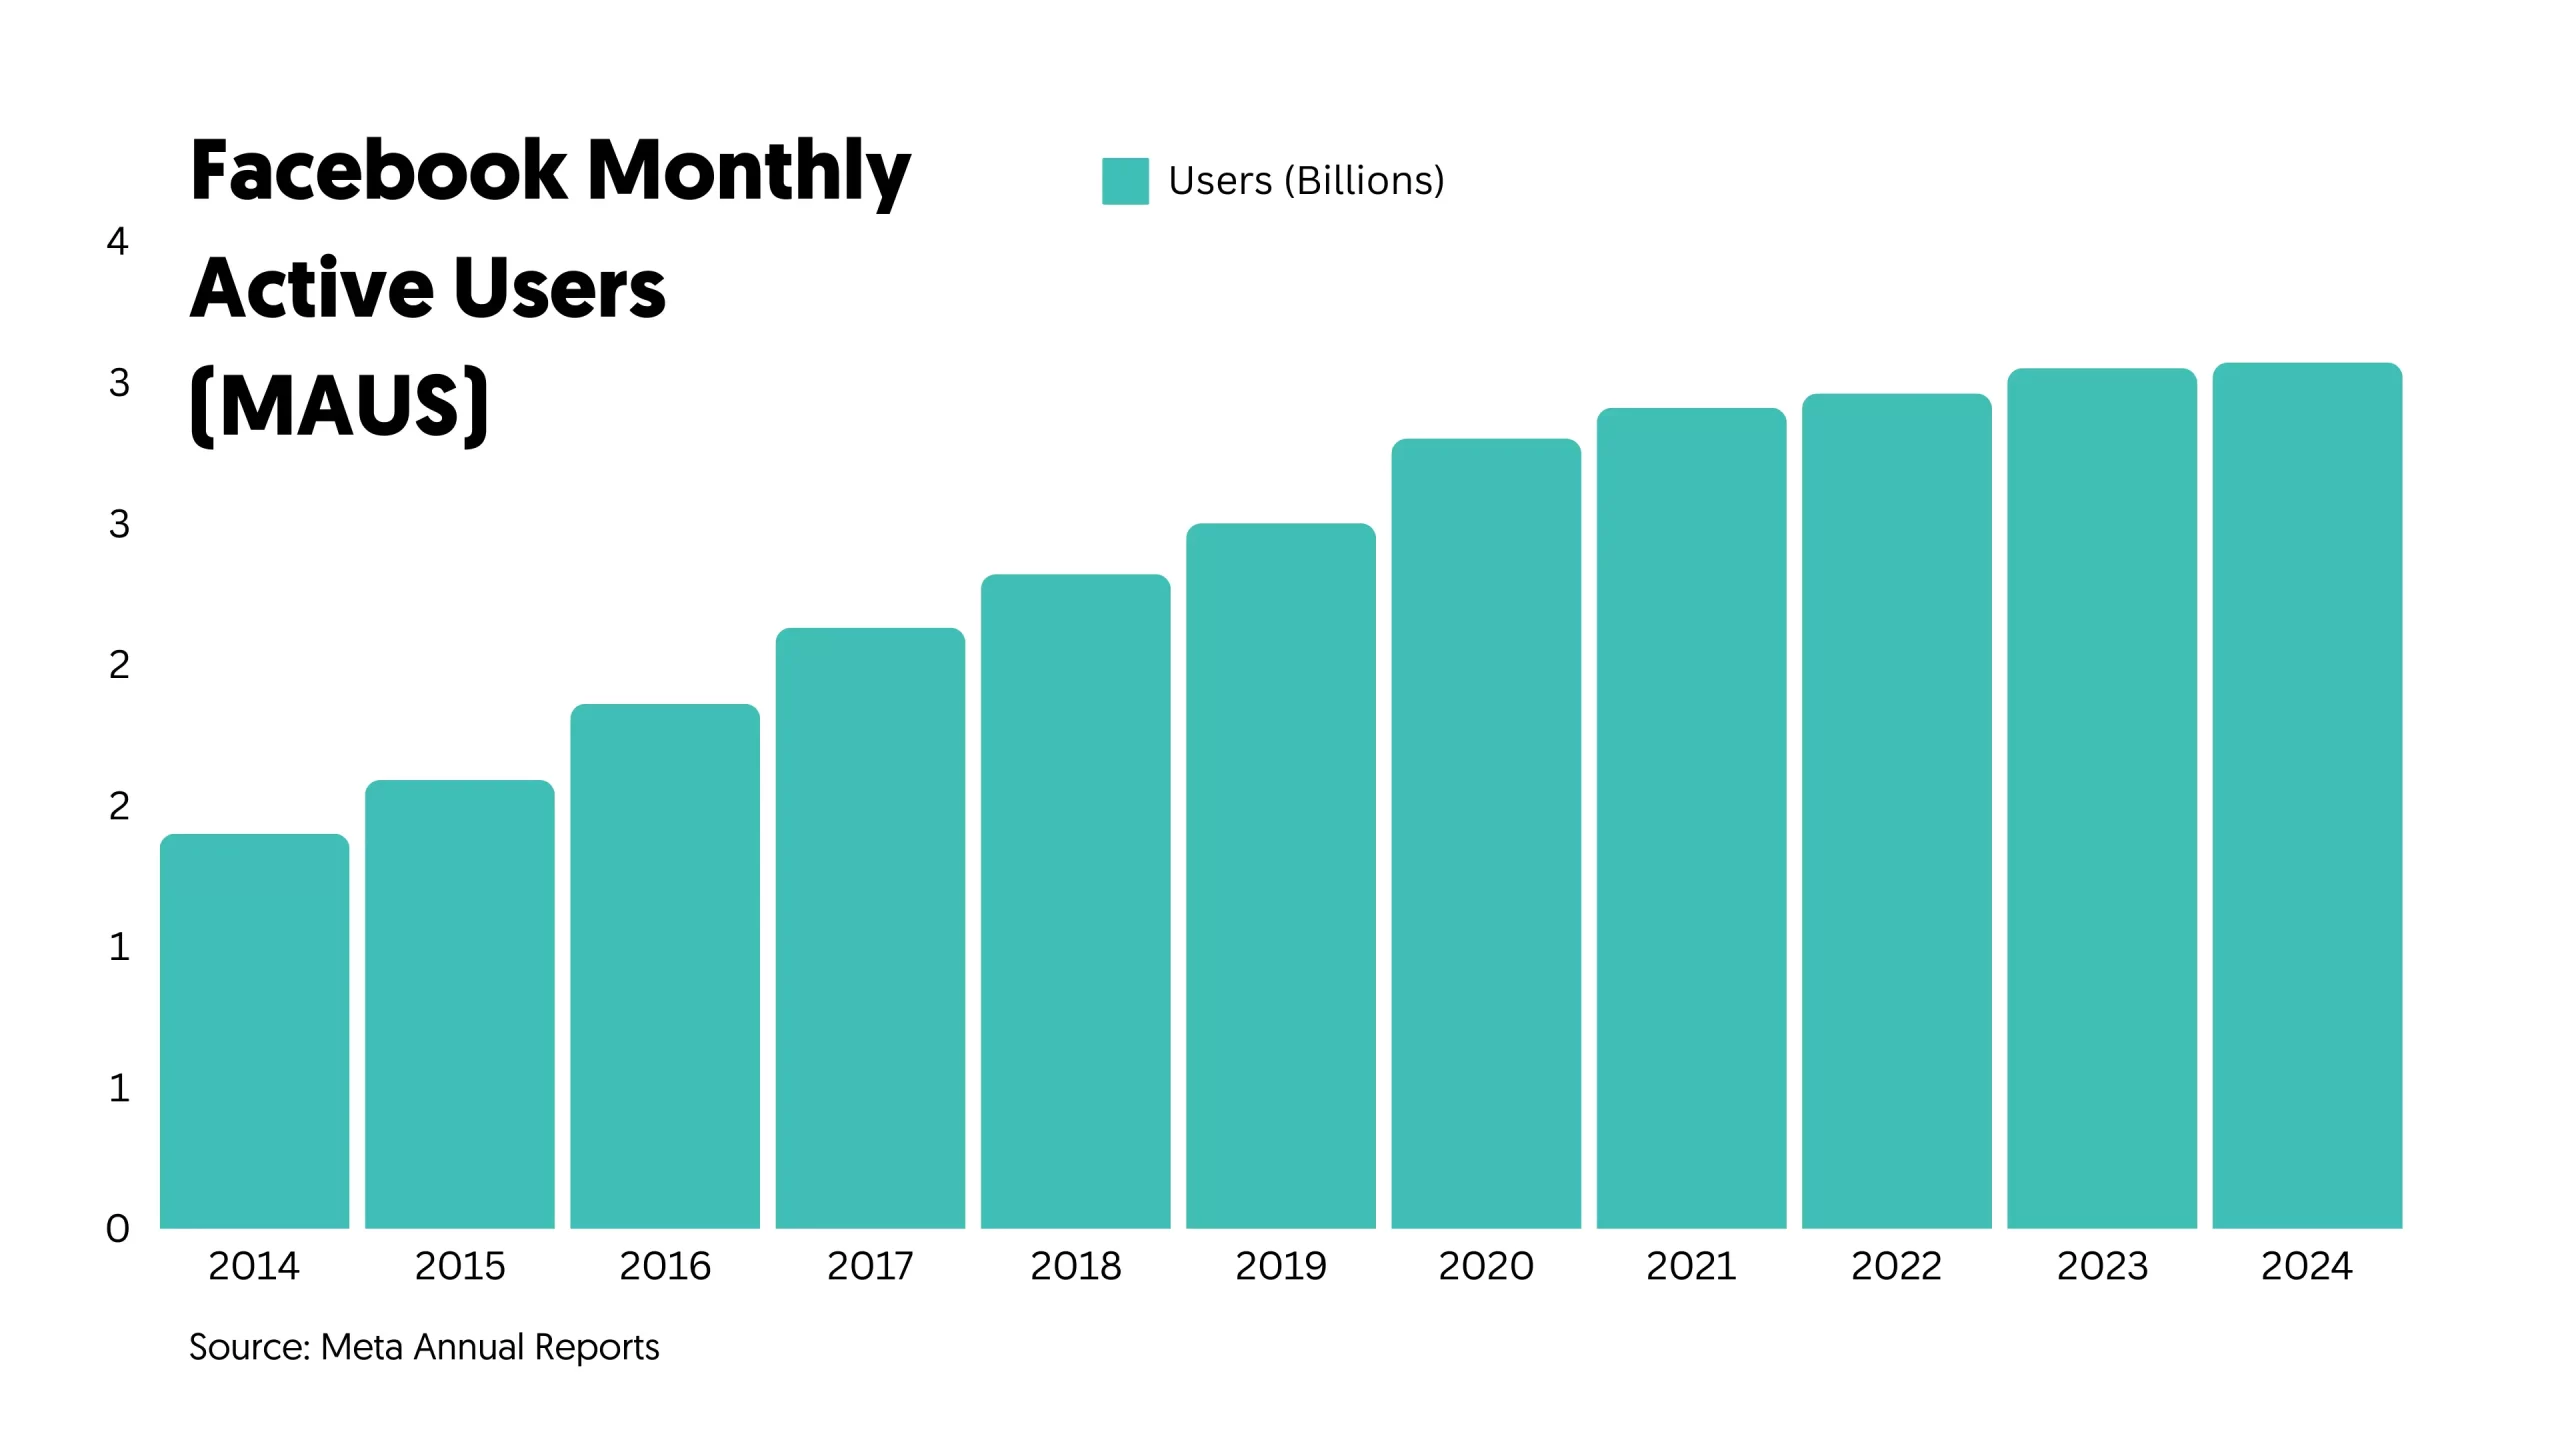
Facebook is adding thousands of new users daily. Despite heavy competition, the company is growing steadily year over year, reaching a stunning 3.049 billion monthly active users in January 2024.

1. How Many Users Does Facebook Have?
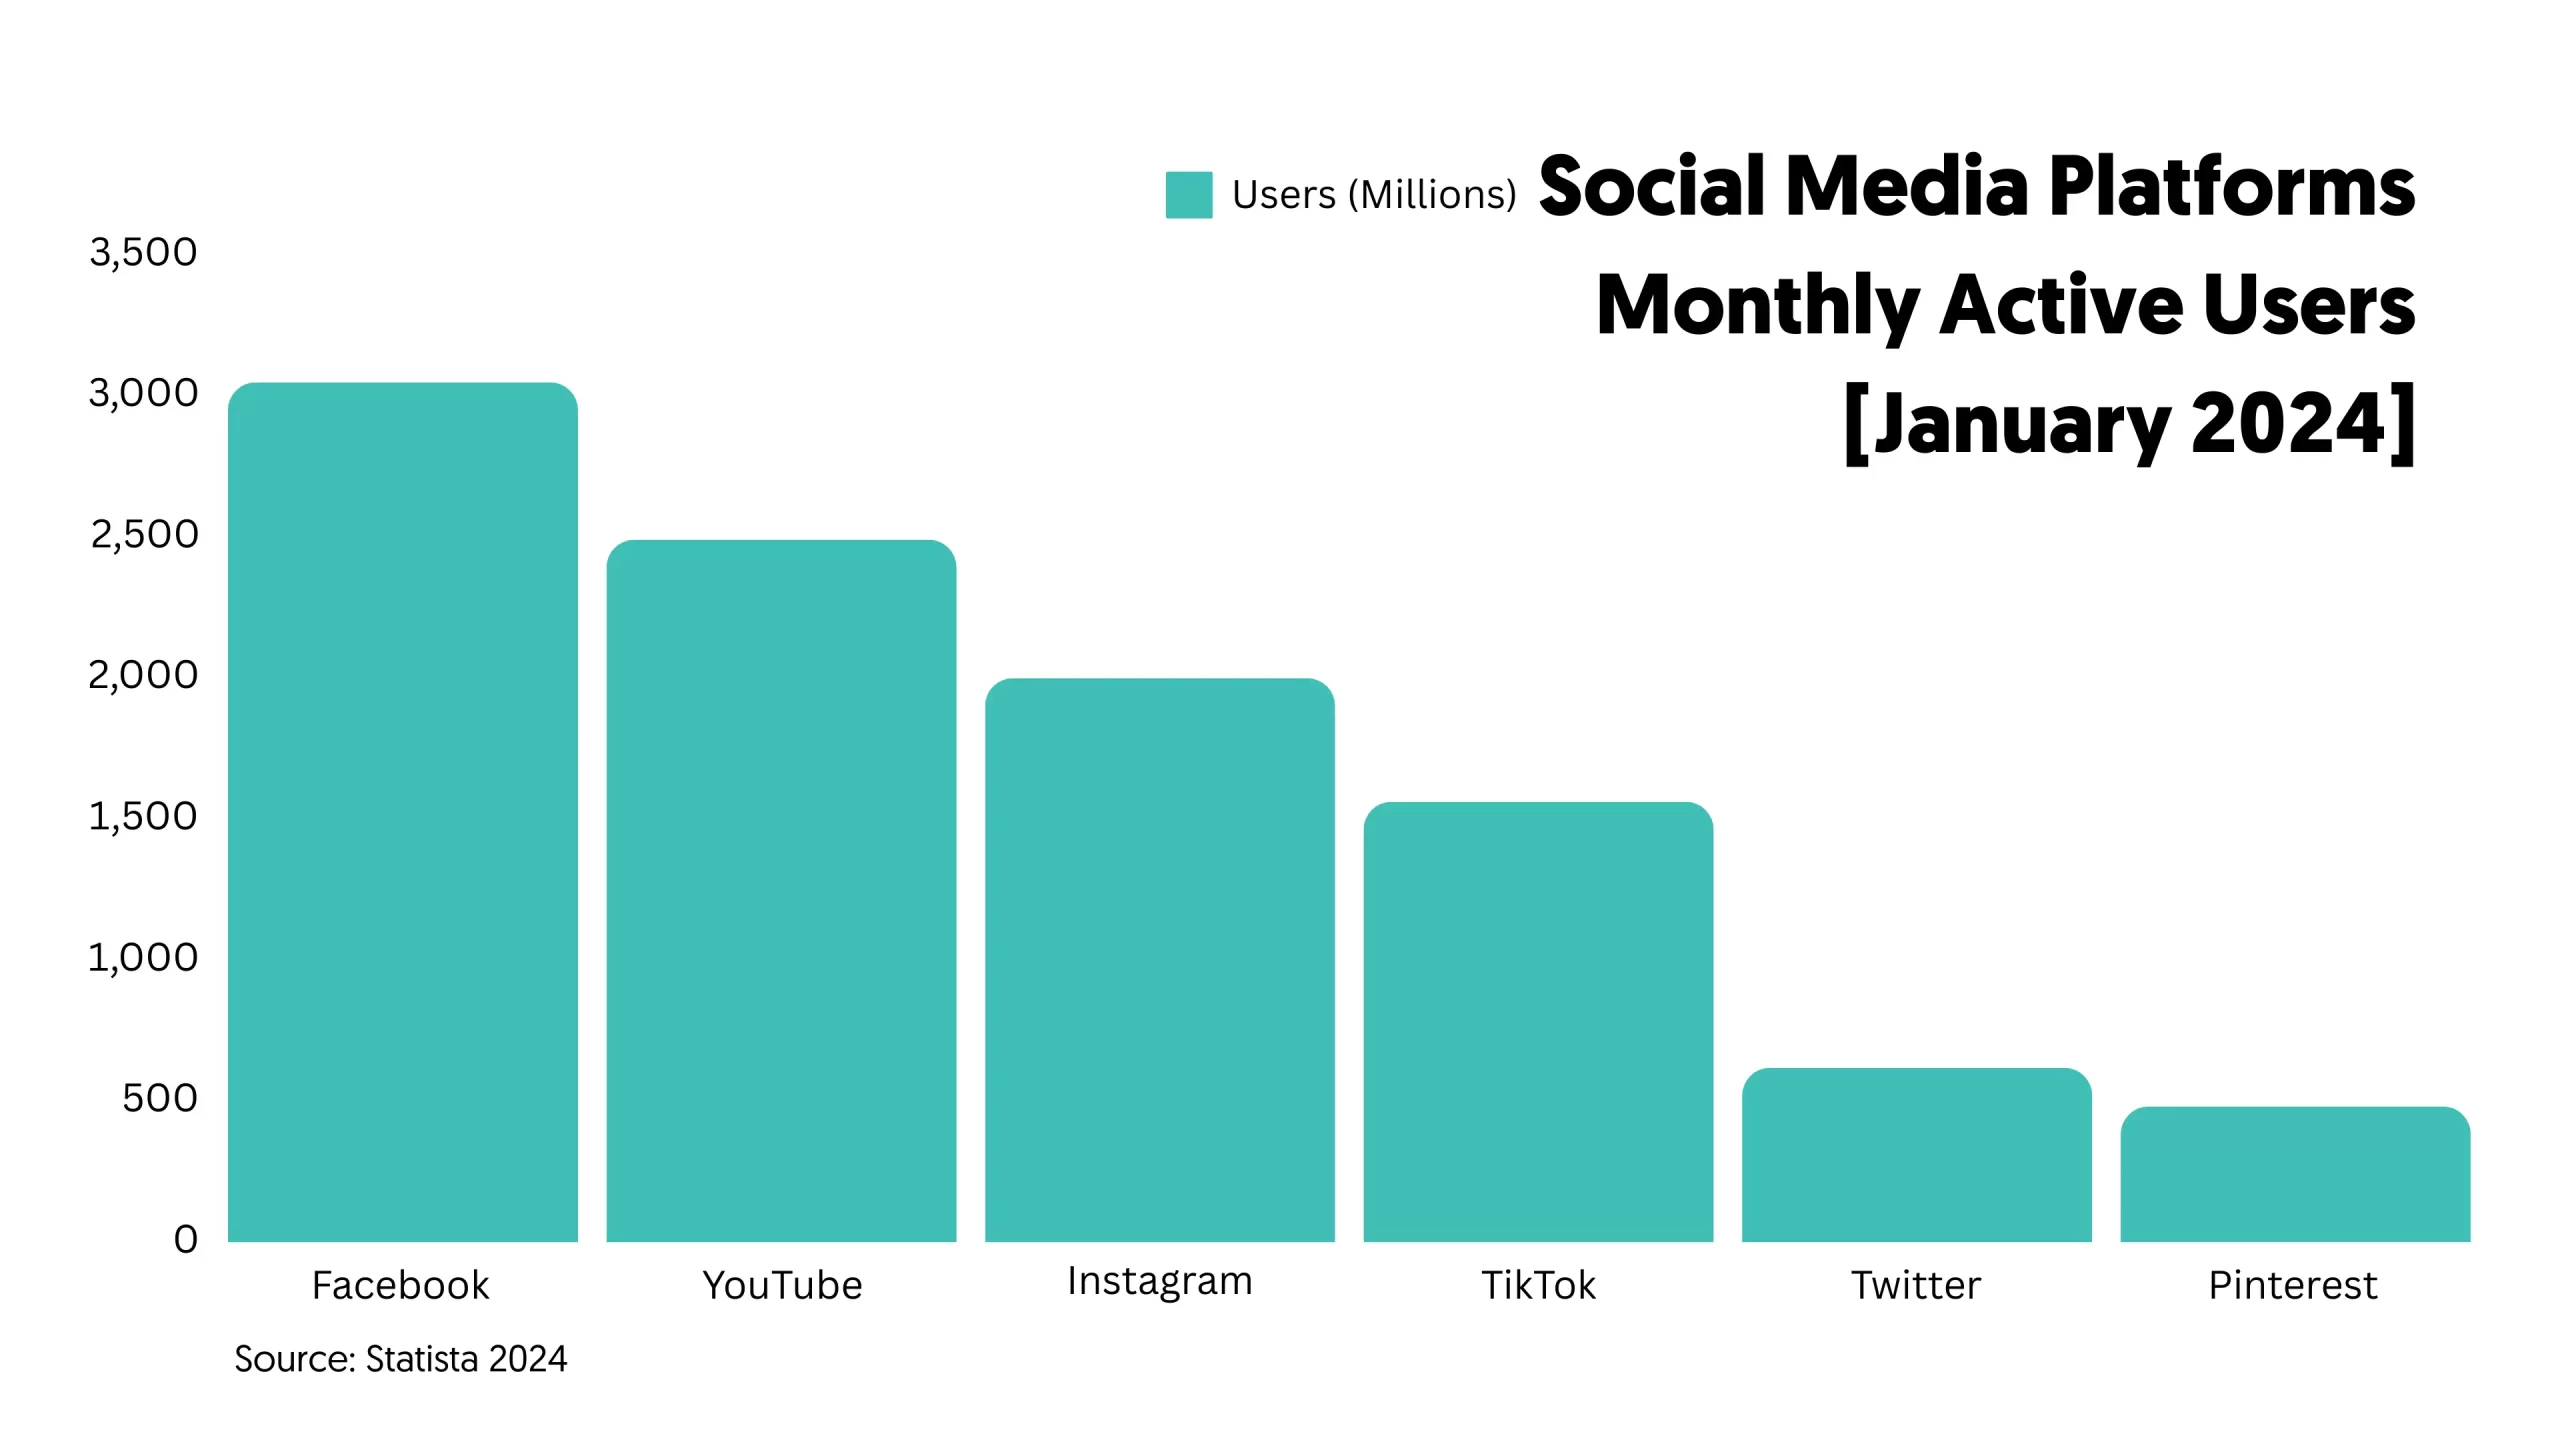
Facebook has 3.049 billion monthly active users as of Q3 2023. It is the largest social media platform in the world, followed by YouTube (2.491 billion), WhatsApp and Instagram each with 2 billion users. Most Facebook users are in India (385 million) and the United States (188 million). (source)
2. How Many Users Use Facebook Daily?
As of the fourth quarter of 2023, Facebook had approximately 2.1 billion daily active users (DAUs), marking a slight increase from the previous quarter. This growth represents an addition of around 100 million users compared to the final quarter of 2022. (source)
Daily Active Users (DAUs) are registered and logged-in users who use Facebook (or Messenger) daily.
3. How Many Users Use Facebook Monthly?
According to Meta official sources, Facebook's monthly active users (MAUs) were 3.07 billion as of December 31, 2023, an increase of 3% year-over-year. The US and Canada account for 272 million users, Europe for 408 million, and Asia & Pacific for 1,367. Compared to the previous year, the increase came from users in India, Bangladesh, and Nigeria. (source)
Monthly Active Users (MAUs) are registered and logged-in users who have used Facebook (or Messenger) in the last 30 days.

4. What Is The Growth Rate of Facebook Users?
According to the official Meta annual reports, the growth rate of Facebook's daily active users (DAUs) is 6% yearly. This increase represents the last two years (2023 and 2022). The yearly growth rate between 2020 and 2021 was 8%; between 2021 and 2022, it was 4%. (source)
The table below shows the growth rate of DAUs for the last four years.
| Year | Daily Active Users (DAUs) in Millions | Growth Rate (Compared to the previous year) |
|---|---|---|
| 2021 | 1,929 | 8% |
| 2022 | 2,000 | 4% |
| 2023 | 2,110 | 6% |
| 2024 | 2,236 (estimated) | 6% (estimated) |
5. How Many People Have Left Facebook?
Facebook lost around half a million daily users in the last quarter of 2021. This is the only reported period users have left Facebook. The lost was attributed to the growth of competing video platforms like TikTok and YouTube.
Since 2021, Facebook has been growing its user base at the rate of 4% and 6% annually (for 2022 and 2023). (source)
6. How Many New Users Are Added Every Day On Facebook?
Based on Facebook's daily active users reported numbers, it is estimated that 301,370 users are added every day on Facebook. This number represents the growth between 2022 and 2023. The estimated daily growth rate for 2024 is 345,305 users.
Facebook Users By Country
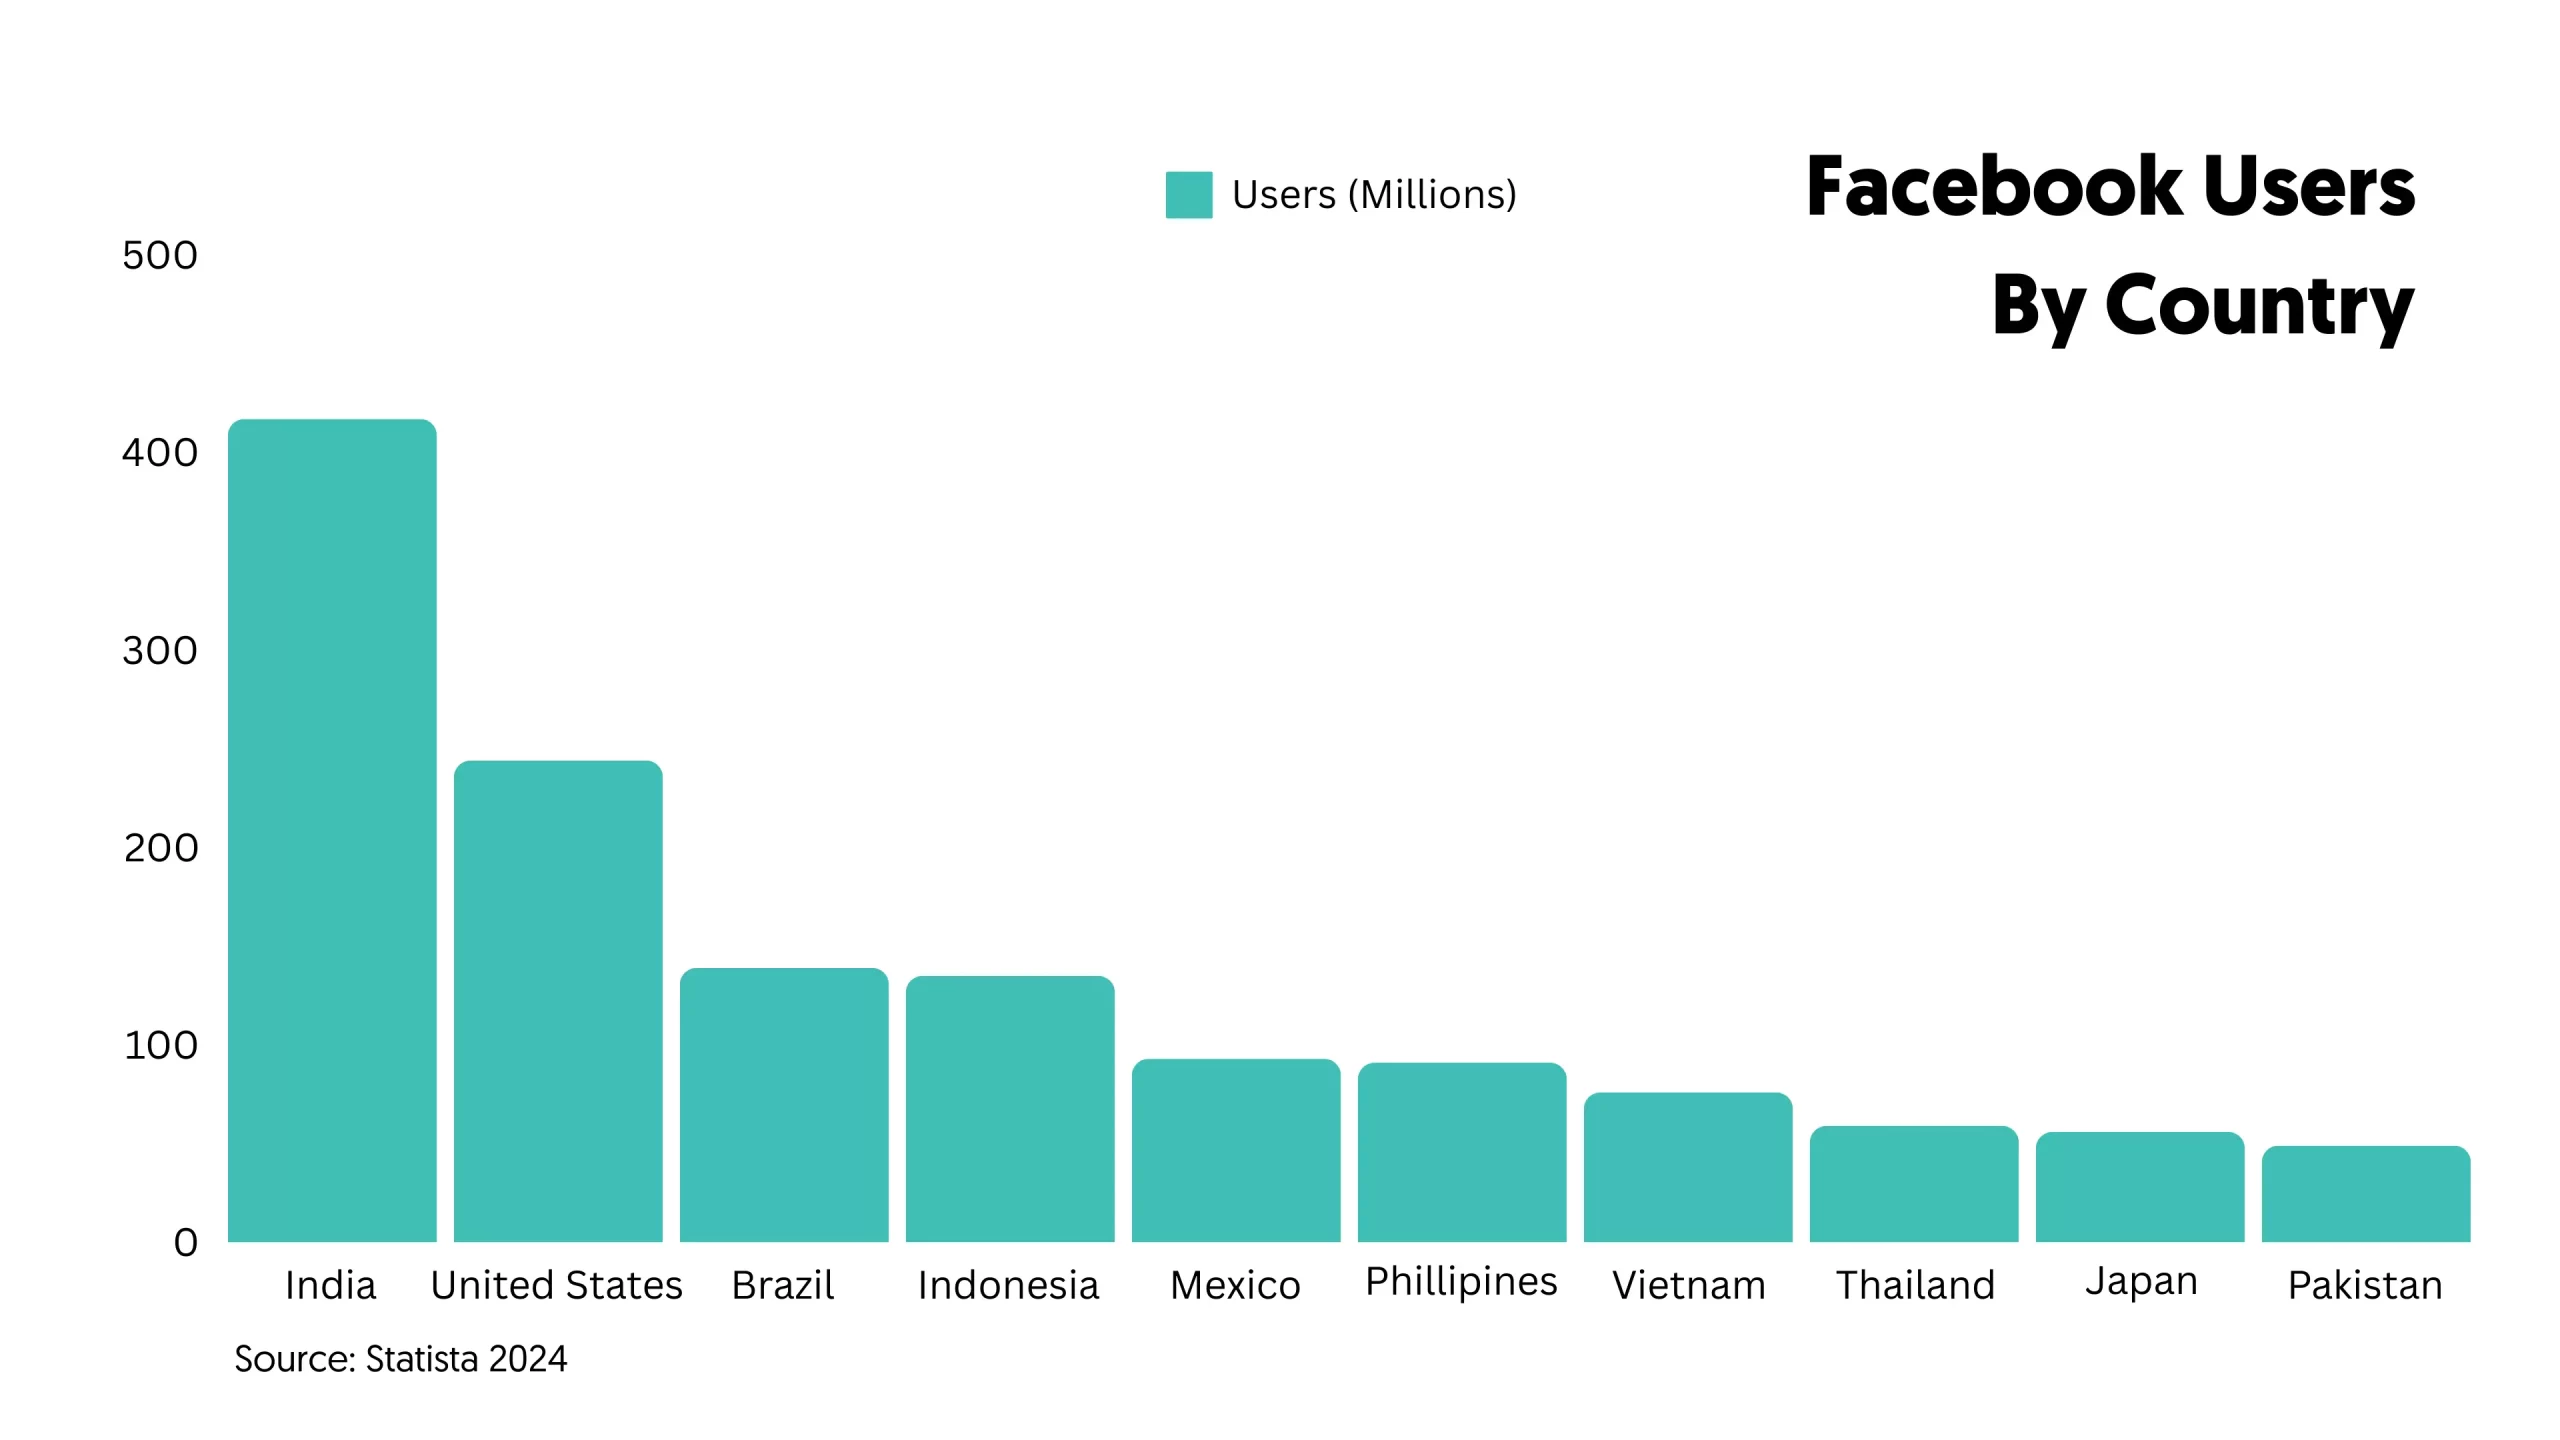
Unsurprisingly, India has the highest number of Facebook users, followed by India, the United States, Indonesia, and Brazil.
7. What Country Uses Facebook The Most?
India has the highest number of Facebook users globally, with an estimated 314.6 million users. Following India, the United States, Indonesia, and Brazil also have substantial Facebook user bases, with 175 million, 119 million, and 109 million users, respectively.
The countries that use Facebook the least are African Countries (Ethiopia, Uganda, and others). Facebook is banned in China and Russia.
These numbers are based on Facebook's audience size in each country based on the number of registered users. (source, source)

8. How Many People In The US Use Facebook?
The number of Facebook users in the United States was 250.2 million in 2024, compared to 246.73 million in 2023 and 243.24 million in 2022. On average, 70% of the US population has a Facebook account, of which 54.7% are female and 45.3% are male. The most popular age group is 25 - 34 (24.4%). (source)
Facebook Demographics
People of all genders and ages use Facebook daily. The biggest group globally is males between the ages of 25 and 34.
9. What Age Group Uses Facebook The Most?
According to recent stats, the age group with the highest number of Facebook users is 25 to 34, representing 29.9% of all Facebook users worldwide. The second largest age group is 18 to 24. (source)
Here's a breakdown of the estimated global Facebook user distribution by age group:
- 18 to 24 years old: 21.5%
- 25 to 34 years old: 29.9%
- 35 to 44 years old: 19.4%
- 45 to 54 years old: 11.6%
- 55 to 64 years old: 7.3%
- 65 years old and older: 5.6%
10. What Gender Uses Facebook The Most?
According to Facebook demographic statistics, most users are males (56.3%), while females account for 43.7%. The distribution of gender per age group is as follows:
- Age 18-24: Male: 12.6%, Female: 8.9%
- Age 25-34: Male: 17.6%, Female: 12.3%
- Age 35-44: Male: 10.9%, Female: 8.5%
- Age 45-54: Male: 6.1%, Female: 5.5 %
11. What Are The Biggest Demographics of Users On Facebook?
According to a recent survey, the biggest demographic of Facebook users in the United States is females aged 30-49 with a college-level education and earning more than $70,000 to $99,999. (source)
In detail, the demographic has the following characteristics:
Age Group
- 67% of users are in the age of 18-29
- 75% of users are in the age of 30-49
- 69% of users are in the age of 50-64
Gender
- 59% of users are male
- 76% of users are female
Education
- 64% of users are educated at high school or less
- 71% of users are educated at the college level
- 70% of users are educated at more than college level
Income
- 63% of people earning less than $30,000
- 70% of people earning between $30,000 to $69,999
- 74% of people earning more than $70,000 to $99,999
12. Who Is The Target Audience of Facebook?
Facebook's primary target audience is people between 18 and 44 who use Facebook on a mobile device. Advertisers highly value this target audience for their purchasing power and openness to technology and social media engagement.
In the United States, the target audience is females (30-49) with a college-level education and earning more than $70,000 to $99,999.
Facebook Usage
The average person globally spends more than 30 minutes daily on Facebook. Facebook users in Turkey, Argentina, and Brazil spend more than 20 hours per month messaging with friends and family or sharing updates.
13. How Much Time Does The Average Person Spend On Facebook Per Day?
According to various sources, the average time a person spends on Facebook per day is 33 minutes. The daily time on Instagram, YouTube, and TikTok is 29, 19, and 95 minutes, respectively. (source)
14. How Many Hours A Month Does The Average Facebook User Spend On Facebook?
The average time a person spends on Facebook monthly is 990 minutes or 19.6 hours. The total time users spend on social media monthly is around 73.5 hours.
15. Average Time Spent On Facebook Per Monthy By Country
The average time a person spends on Facebook per month is 19.6 hours. The countries with higher usage are Turkey, Argentina, and Brazil, with 24.5, 21.4, and 19.7 monthly hours, respectively.
The table below shows the average monthly usage of Facebook per country (in hours). (source)
| Country | Average hours per month |
|---|---|
| Turkey | 24.5 |
| Argentina | 21.4 |
| Brazil | 19.7 |
| Indonesia | 18.0 |
| India | 17.8 |
| Worldwide | 15.7 |
| Russia | 15.5 |
| Canada | 15.5 |
| Singapore | 14.7 |
| Australia | 14.6 |
| France | 12.9 |
| Germany | 12.3 |
| United Kingdom | 10.6 |
| United States | 9.9 |
| Mexico | 7.1 |
16. Why Do People Use Facebook?
According to user surveys, the most popular use of Facebook is messaging friendly and family (71%), posting and sharing updates (64%), and reading the news (60%). (source)
Here is a breakdown of the most popular uses of Facebook according to users:
- 71% use Facebook to message friends and family
- 64% use Facebook to post or share photos or videos
- 60% use Facebook to read news and current events
- 56% use Facebook to research brands and products
- 55% use Facebook for entertainment purposes
The above statistics include using all Facebook Family products (Facebook, Instagram, Messenger, and WhatsApp).
Facebook Reach By Device
It's no surprise that the vast majority of people use Facebook on a mobile device. Only 1.5% use it on a desktop or mobile. This is an important statistic for marketers who need to optimize their campaigns and landing pages for mobile users.
17. How Many Facebook Users Are On Desktop?
On average, only 1.5% of users use Facebook on a desktop or laptop device, while 16.7% use it only on mobile and desktop devices.
- 98.5% use Facebook on mobile (preferred device)
- 81.8% use Facebook only on mobile.
- 16.7% use Facebook on mobile and desktop.
18. How Many Facebook Users Are On Mobile?
A stunning 98.5% of Facebook users are on mobile, with 81.8% saying that they use mobile only and not desktop. The number of users that use both desktop and mobile is 16.7%
Facebook Advertising
Facebook has the biggest audience for advertising than any other medium (except Google Search). Despite the high cost of ad clicks, it's still one of the most valuable digital marketing channels for marketing professionals.
19. How Many People Do Facebook Ads Reach On Average?
Facebook's ad reach is 1.98 billion. This number reflects data as of January 2024 and is based on the total number of monthly active Facebook users. It is estimated that around 75% of the MAUs are shown an ad on any Meta app. (source)
20. What Is The Average Click Rate (CTR) For Facebook Ads?
The average click-through rate (CTR) for Facebook ads is 1.51%. The industry with the highest CTR is Arts & Entertainment, with 2.55%, and the lowest is Dentist & Dental Services, with 0.81%. (source)
CTR represents the percentage of people who see an ad and then click on it. It is calculated by dividing the number of clicks your ad receives by the number of times your ad is shown (impressions) and then multiplying the result by 100 to get a percentage.
21. What Is The Average Cost Per Click (CPC) On Facebook Ads?
The average cost per click on Facebook Ads is $0.83. This value represents the objective of generating traffic to your website. For lead generation, the average CPC is $1.92. (source)
The top 5 more expensive industries for generating traffic from Facebook ads are:
| Industry | Average CPC |
|---|---|
| Dentists & Dental Services | $1.27 |
| Furniture | $1.19 |
| Attorneys & Legal Services | $1.15 |
| Apparel / Fashion & Jewelry | $1.11 |
| Finance & Insurance | $1.11 |
The top 5 more expensive industries for generating leads from Facebook ads are:
| Industry | Average CPC |
|---|---|
| Attorneys & Legal Services | $5.42 |
| Dentists & Dental Services | $3.82 |
| Physicians & Surgeons | $3.63 |
| Health & Fitness | $3.6 |
| Finance & Insurance | $2.94 |
Facebook Family of Apps (FoA) Metrics
Meta's product group includes Facebook, Instagram, Messenger, and WhatsApp. For marketing purposes, marketers can run campaigns targeting users and all products, and thus, it's important to know the total audience size.
22. How Many People Use Facebook’s Family of Products?
According to official reports, more than 3.98 billion people (MAPs) were using at least one Meta product each month in the last quarter of 2023. (source)
Meta defines monthly active people (MAPs) as the number of registered users using one or more apps (Facebook, Instagram, WhatsApp, Messenger) in the last 30 days. This includes users on mobile apps or web browsers.
Facebook Financials
Since 2004, Facebook's revenue has been increasing year over year. The best financial year was 2023, with more than 134 billion in revenue.
23. How Much Money Does Facebook Make?
According to Meta's official reports, Facebook's revenue for 2023 was $134,902 million. This revenue increased 15.7% compared to $116,609 million in 2022. (source)
Here is a breakdown of how much money Facebook made in the last 10 years.
| Year | Income ($Billions) |
|---|---|
| 2014 | 12.46 |
| 2015 | 17.92 |
| 2016 | 27.63 |
| 2017 | 40.65 |
| 2018 | 55.83 |
| 2019 | 70.69 |
| 2020 | 85.96 |
| 2021 | 117.92 |
| 2022 | 116.6 |
| 2023 | 134.9 |
24. How Many Employees Does Facebook Have?
Facebook employs 67,317 people as of December 2023. Since 2004, the number of Facebook employees has been increasing steadily until 2022, when it reached the top with 86,482 people. (source)
The table below shows the change in the number of people employed by Facebook in the last 10 years.
| Year | No of Employees |
|---|---|
| 2014 | 9,199 |
| 2015 | 12,691 |
| 2016 | 17,048 |
| 2017 | 25,105 |
| 2018 | 35,587 |
| 2019 | 44,942 |
| 2020 | 58,604 |
| 2021 | 71,970 |
| 2022 | 86,482 |
| 2023 | 67,317 |


