Google Analytics is essential for any digital marketer, business owner, or content creator. It helps you understand how users interact with your website and make data-driven decisions.
Finding the right course can make all the difference in your learning journey. In this post, we’ve reviewed some of the best Google Analytics courses for beginners and even experts looking to build their Google Analytics skills and get certified.
9 Top Google Analytics Courses
- Manage GA4 Data And Learn To Read Reports By Google (Free)
- Google Analytics Course By Reliablesoft
- Google Analytics Certification By Google (Free)
- Google Analytics For Beginners By Udemy
- Introduction to Google Analytics By Simplilearn (Free)
- Google Analytics Certification Training By CXL
- Google Analytics 4 (GA4) Essential Training By LinkedIn
- Analytics Essentials By LovesData (Free)
- Google Analytics For Business Marketing By Skillshare
1. Manage GA4 Data And Learn To Read Reports By Google (Free)
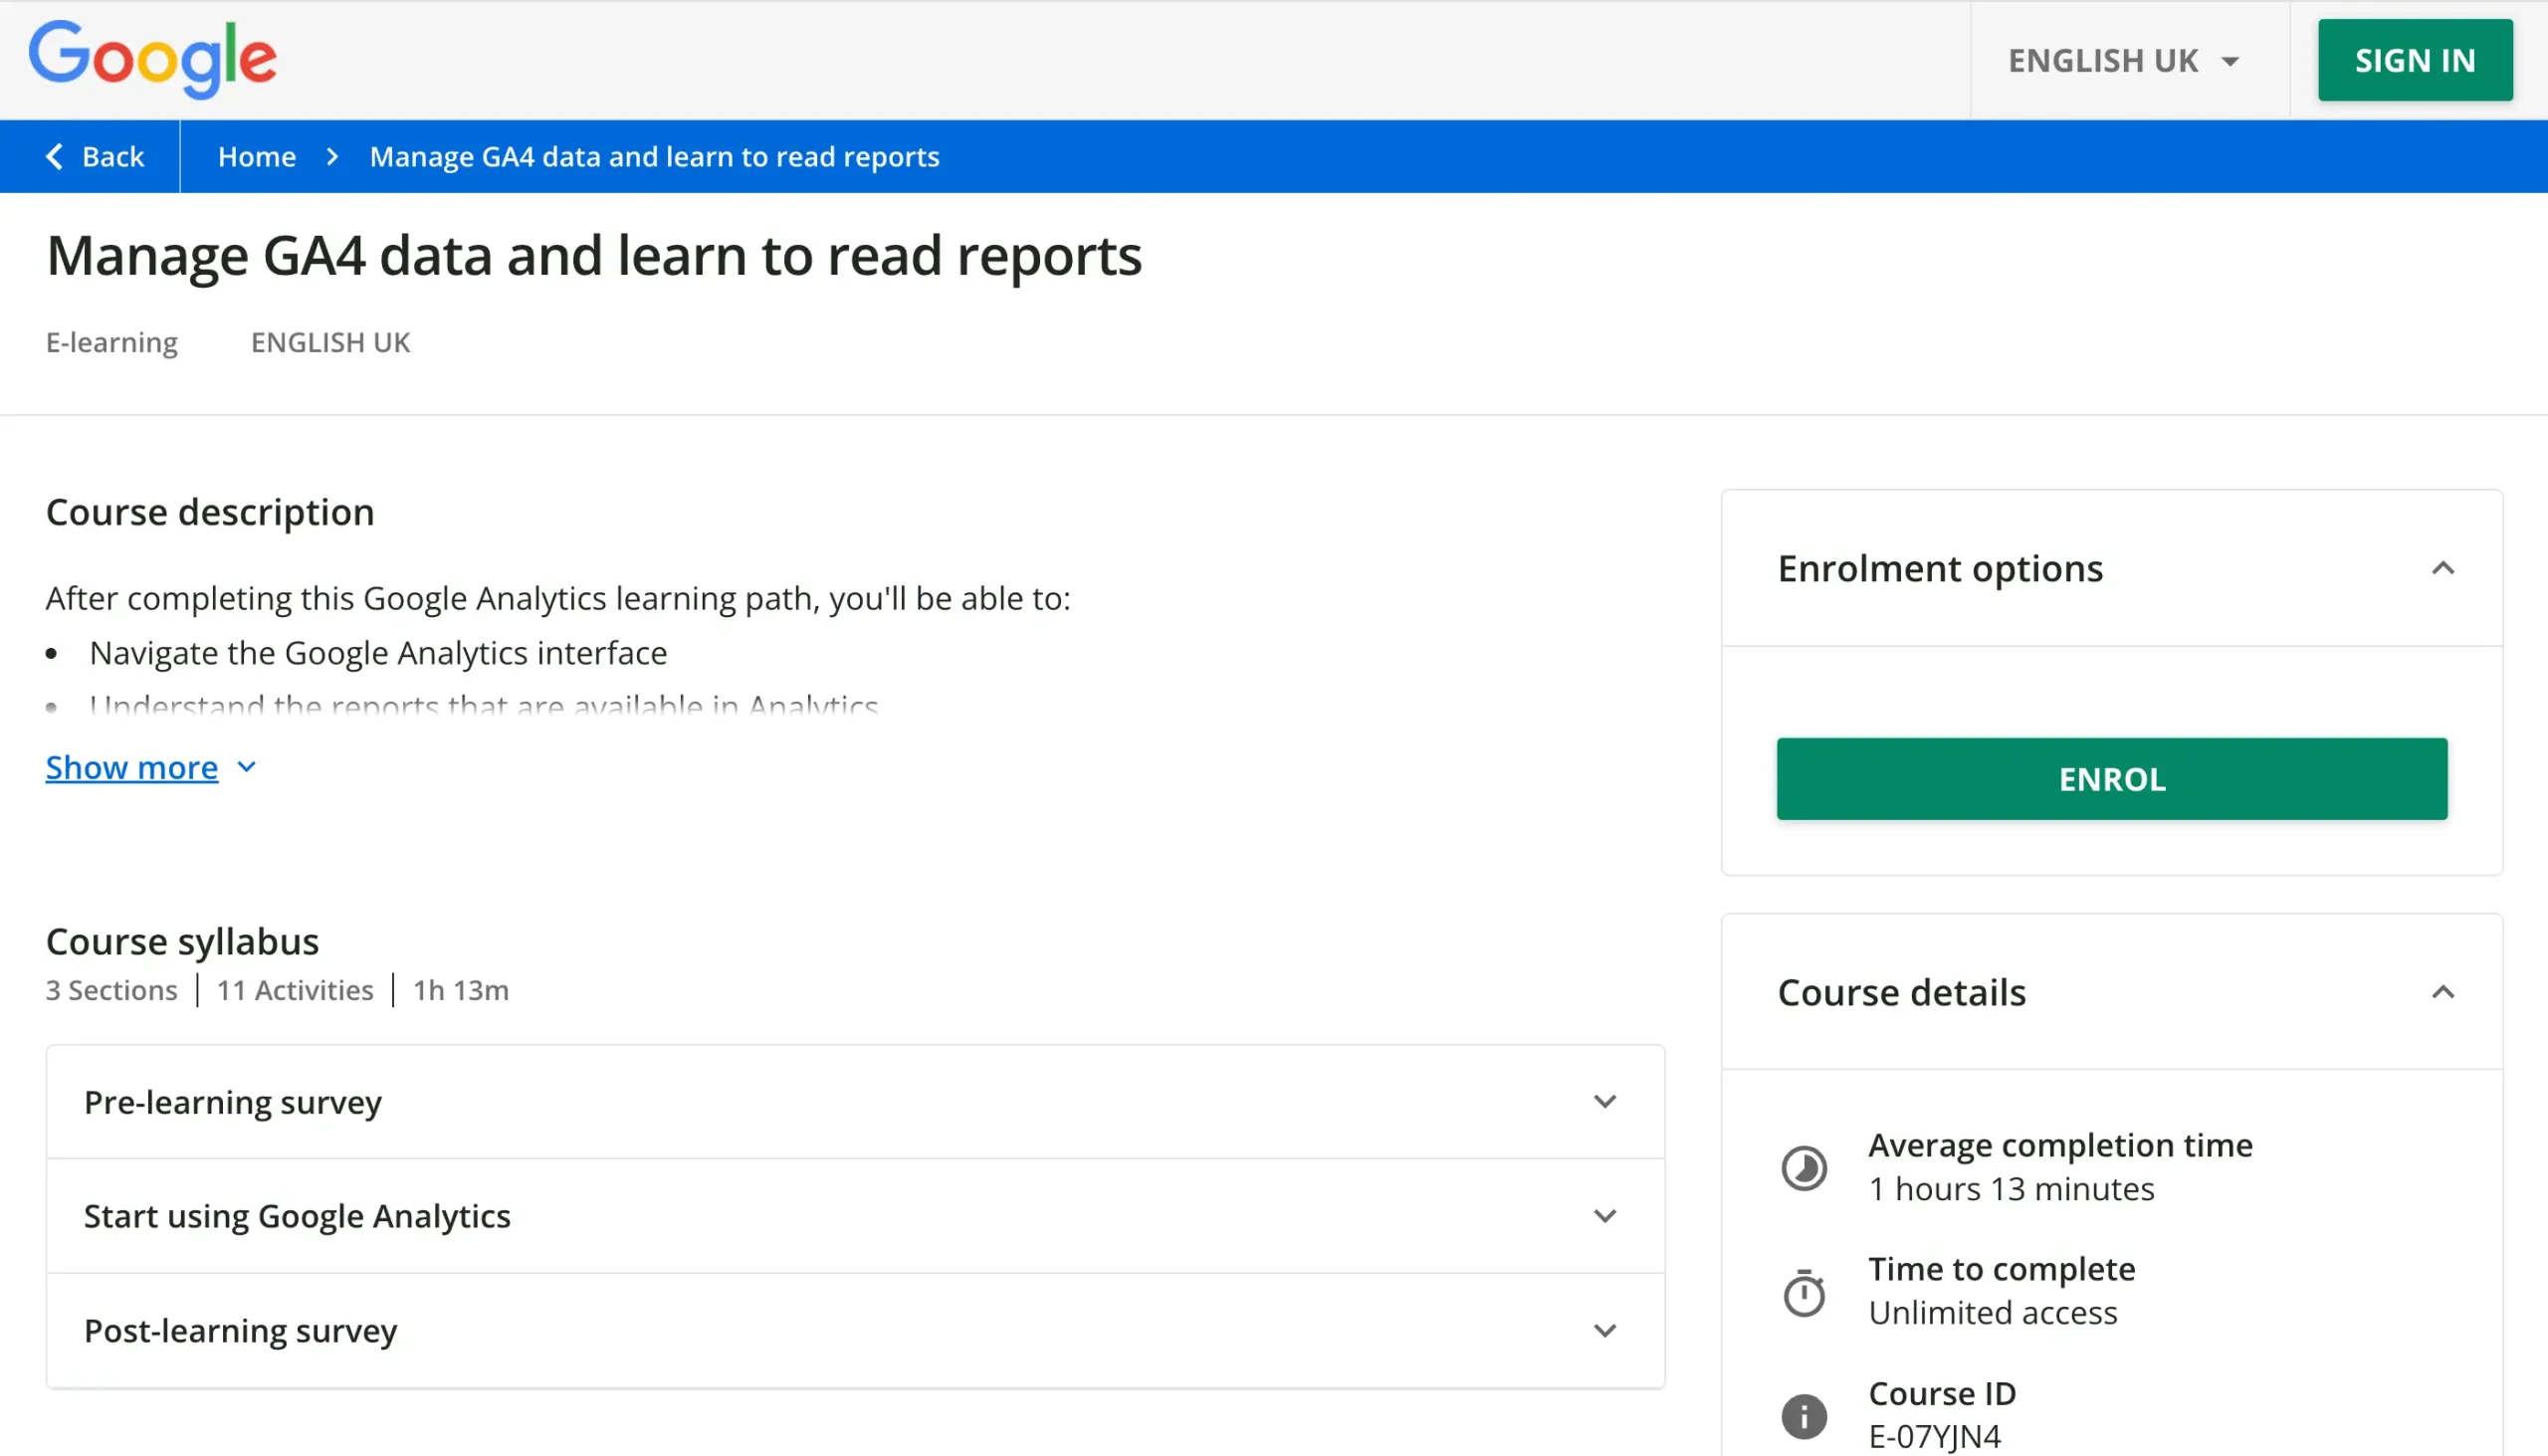
- Cost: Free
- Duration: 1 hour
- Level: Beginner
- Certification: No
The Manage GA4 Data And Learn To Read Reports course is ideal for newbies who want to start with Google Analytics. It takes around 1 hour and is offered for free.
Previously, this course was part of the Google Analytics Academy, which is now integrated into Google Skillshop.
This Google Analytics tutorial is perfect for beginners. It shows you how to set up your Google Analytics environment, navigate Google Analytics, and understand basic reports.
Topics covered include:
- Use Digital Analytics to Grow Your Business
- Learn How Google Analytics Handles Data
- Create Your Google Analytics Account and Property
- Set Up Your Website for Data Collection
- Set Up Your App for Data Collection
- Confirm Data Is Being Collected
- Manage Account Access and Settings
- Manage your Google Analytics conversions
- Power Your Reports with Dimensions and Metrics
- Filter and compare data in reports
Why enroll in this course?
It's one of the official courses offered by Google Analytics Academy. The lessons are short and easy to consume, and there are various hands-on activities and quizzes to test your knowledge.
It's a great starting point for new Google Analytics users.
2. Google Analytics Course By Reliablesoft

- Cost: $149 (part of a bundle)
- Duration: 4 hours
- Level: Beginner / Intermediate
- Certification: Yes
One of the best alternatives to the Google Analytics official course is the Google Analytics Course delivered by Reliablesoft Digital Marketing Academy.
This course will teach you step-by-step how to use Google Analytics to monitor your website's performance and make data-driven decisions to increase traffic and sales.
The course includes 7 lessons covering the following topics:
- Google Analytics 4 Basics: how to get started with Google Analytics 4.
- Google Analytics 4 Reporting: creating custom reports in GA4 and customizing the reporting environment.
- Google Analytics 4 Reports: how to use Google Analytics 4 reports to improve your SEO.
- Advanced Google Analytics 4: tackling advanced tasks like custom conversions and conversion tracking in Google Analytics 4.
Why enroll in this course?
It's a highly actionable course with many examples and real-life demos.
When you enroll in this course, you have the opportunity to pursue two certifications. An SEO certification and a Digital Marketing Certification.
Course material is updated regularly to consider new developments in Google Analytics.
With your registration, you also gain access to 14 SEO and Digital Marketing courses.
3. Google Analytics Certification By Google (Free)
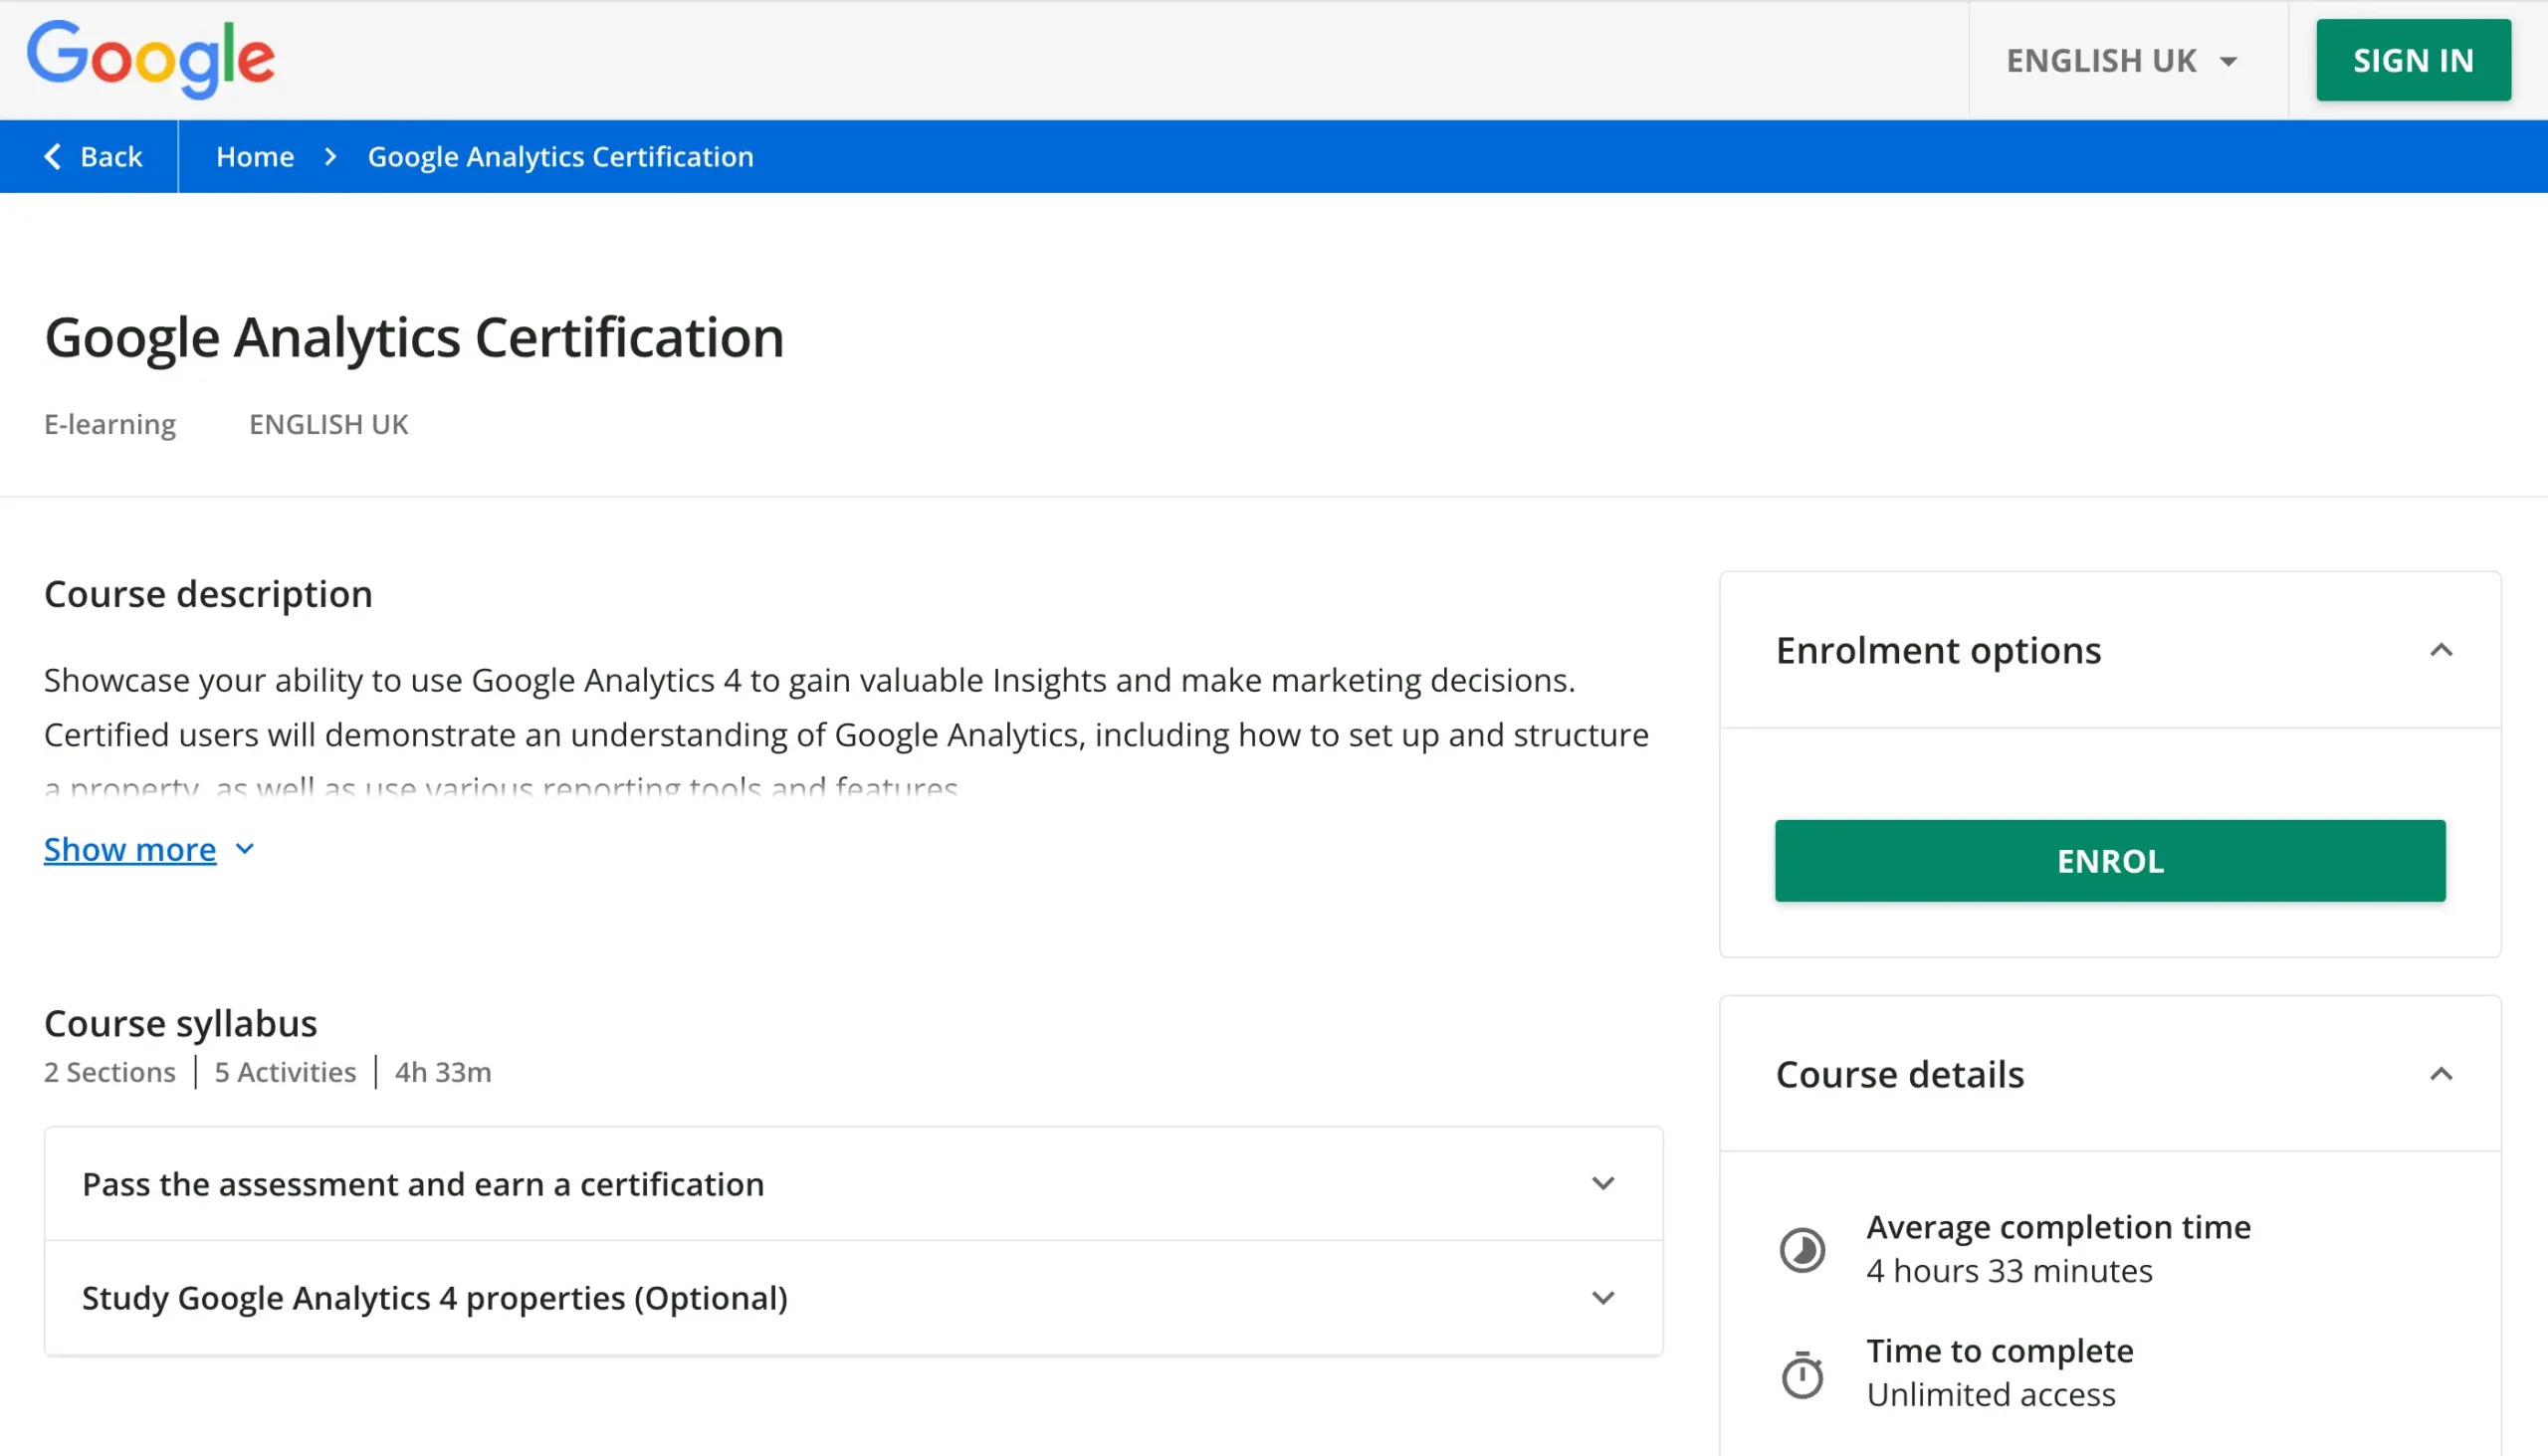
- Cost: Free
- Duration: 4.5 hours
- Level: Beginner
- Certification: Yes
The Google Analytics Certification is the official certificate awarded to students who pass the GA exam successfully.
You can use Google Analytics Academy's free courses to prepare for the exam. In particular, you can go through:
- Use Google Analytics to meet your business objectives
- Measure your marketing with Google Analytics
- Go further with your Google Analytics data
The total time to prepare and take the exams is 4.5 hours.
Why enroll in this course?
This is the course to follow if you want to get the official Google Analytics Certificate.
For more details on how the exams look and what you need to know before taking the test, read our comprehensive guide, Google Analytics Certification: Is It Worth It?
4. Google Analytics For Beginners By Udemy
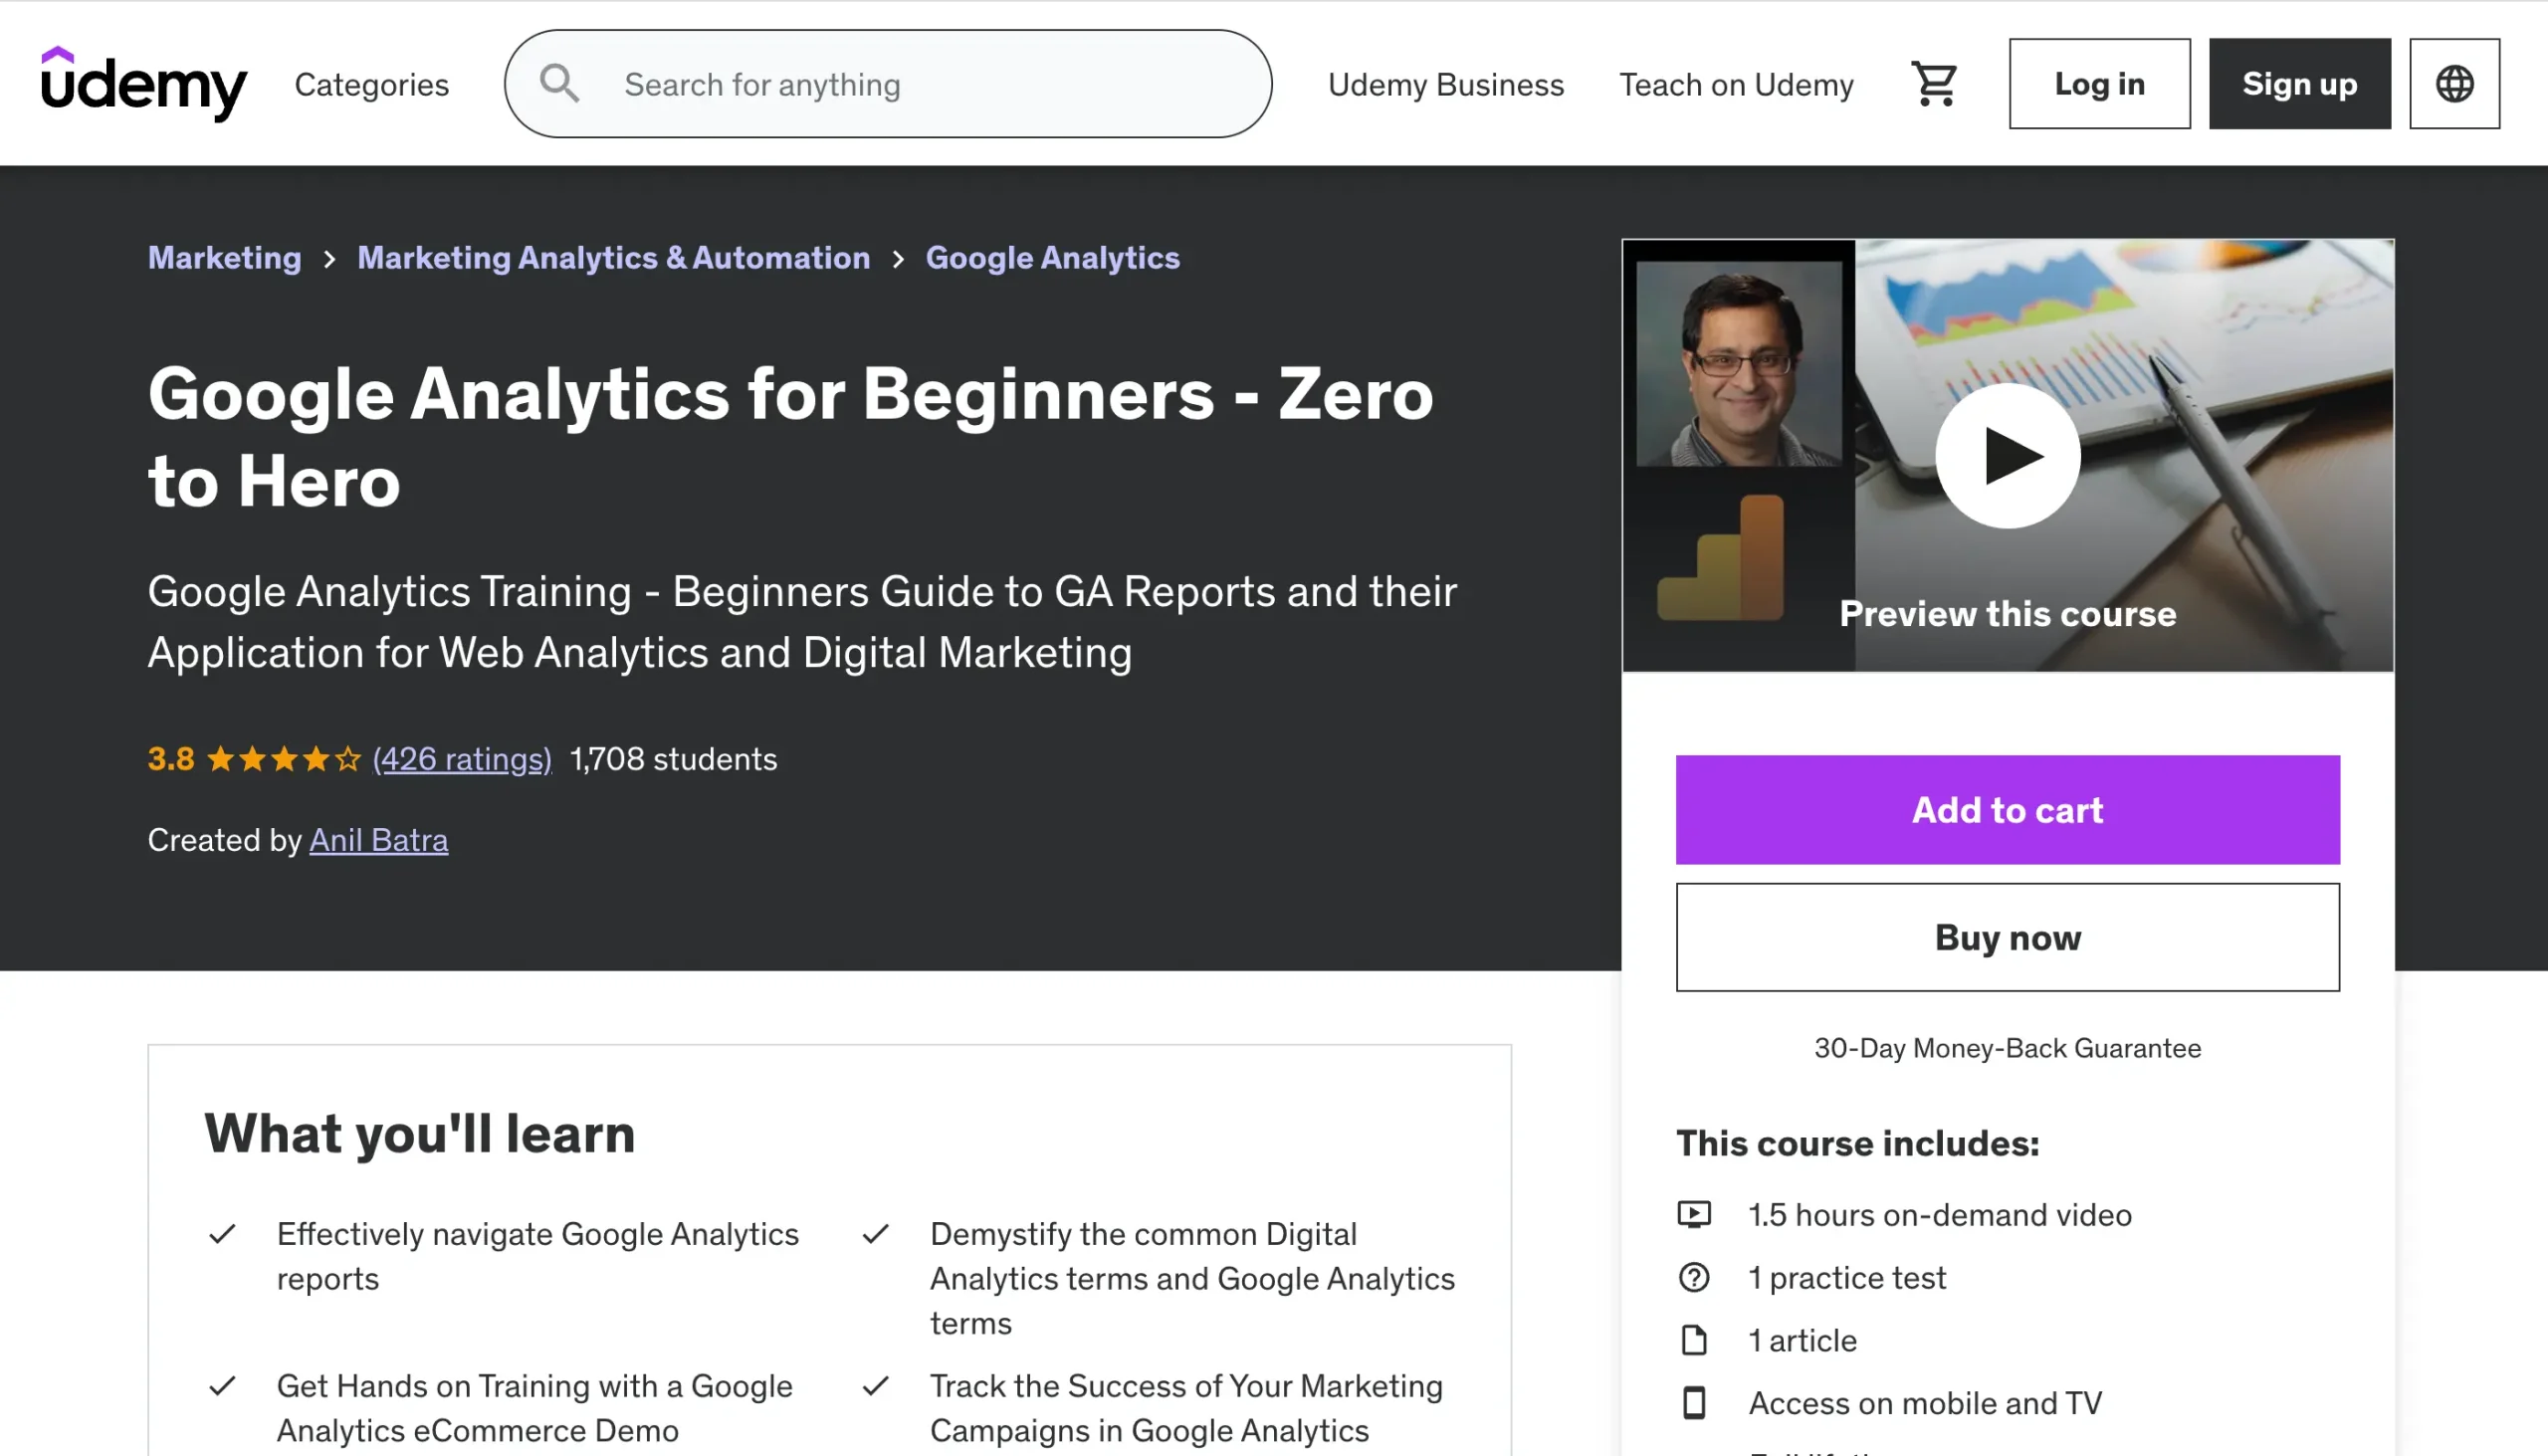
- Cost: $89.99
- Duration: 1.5 hours
- Level: Beginner
- Certification: Yes
The Google Analytics For Beginners - Zero to Hero by Udemy is designed for beginners to Google Analytics, covering core concepts such as navigating reports, setting up tracking, and analyzing website performance.
The Instructor is Anil Batra, a digital marketer with over 15 years of experience.
In addition to video lessons, you’ll also get hands-on training with Google Analytics via an eCommerce demo account.
The course covers the following topics:
- How Google Analytics works.
- Setup Google Analytics
- Google Analytics Reports
- Setting up conversion tracking
The total time to complete all lessons is around 1.5 hours.
Why enroll in this course?
This is a good course to follow to build the skills needed to become a Google Analytics professional with hands-on experience.
5. Introduction to Google Analytics By Simplilearn (Free)
- Cost: Free
- Duration: 5 hours
- Level: Beginner
- Certification: Yes
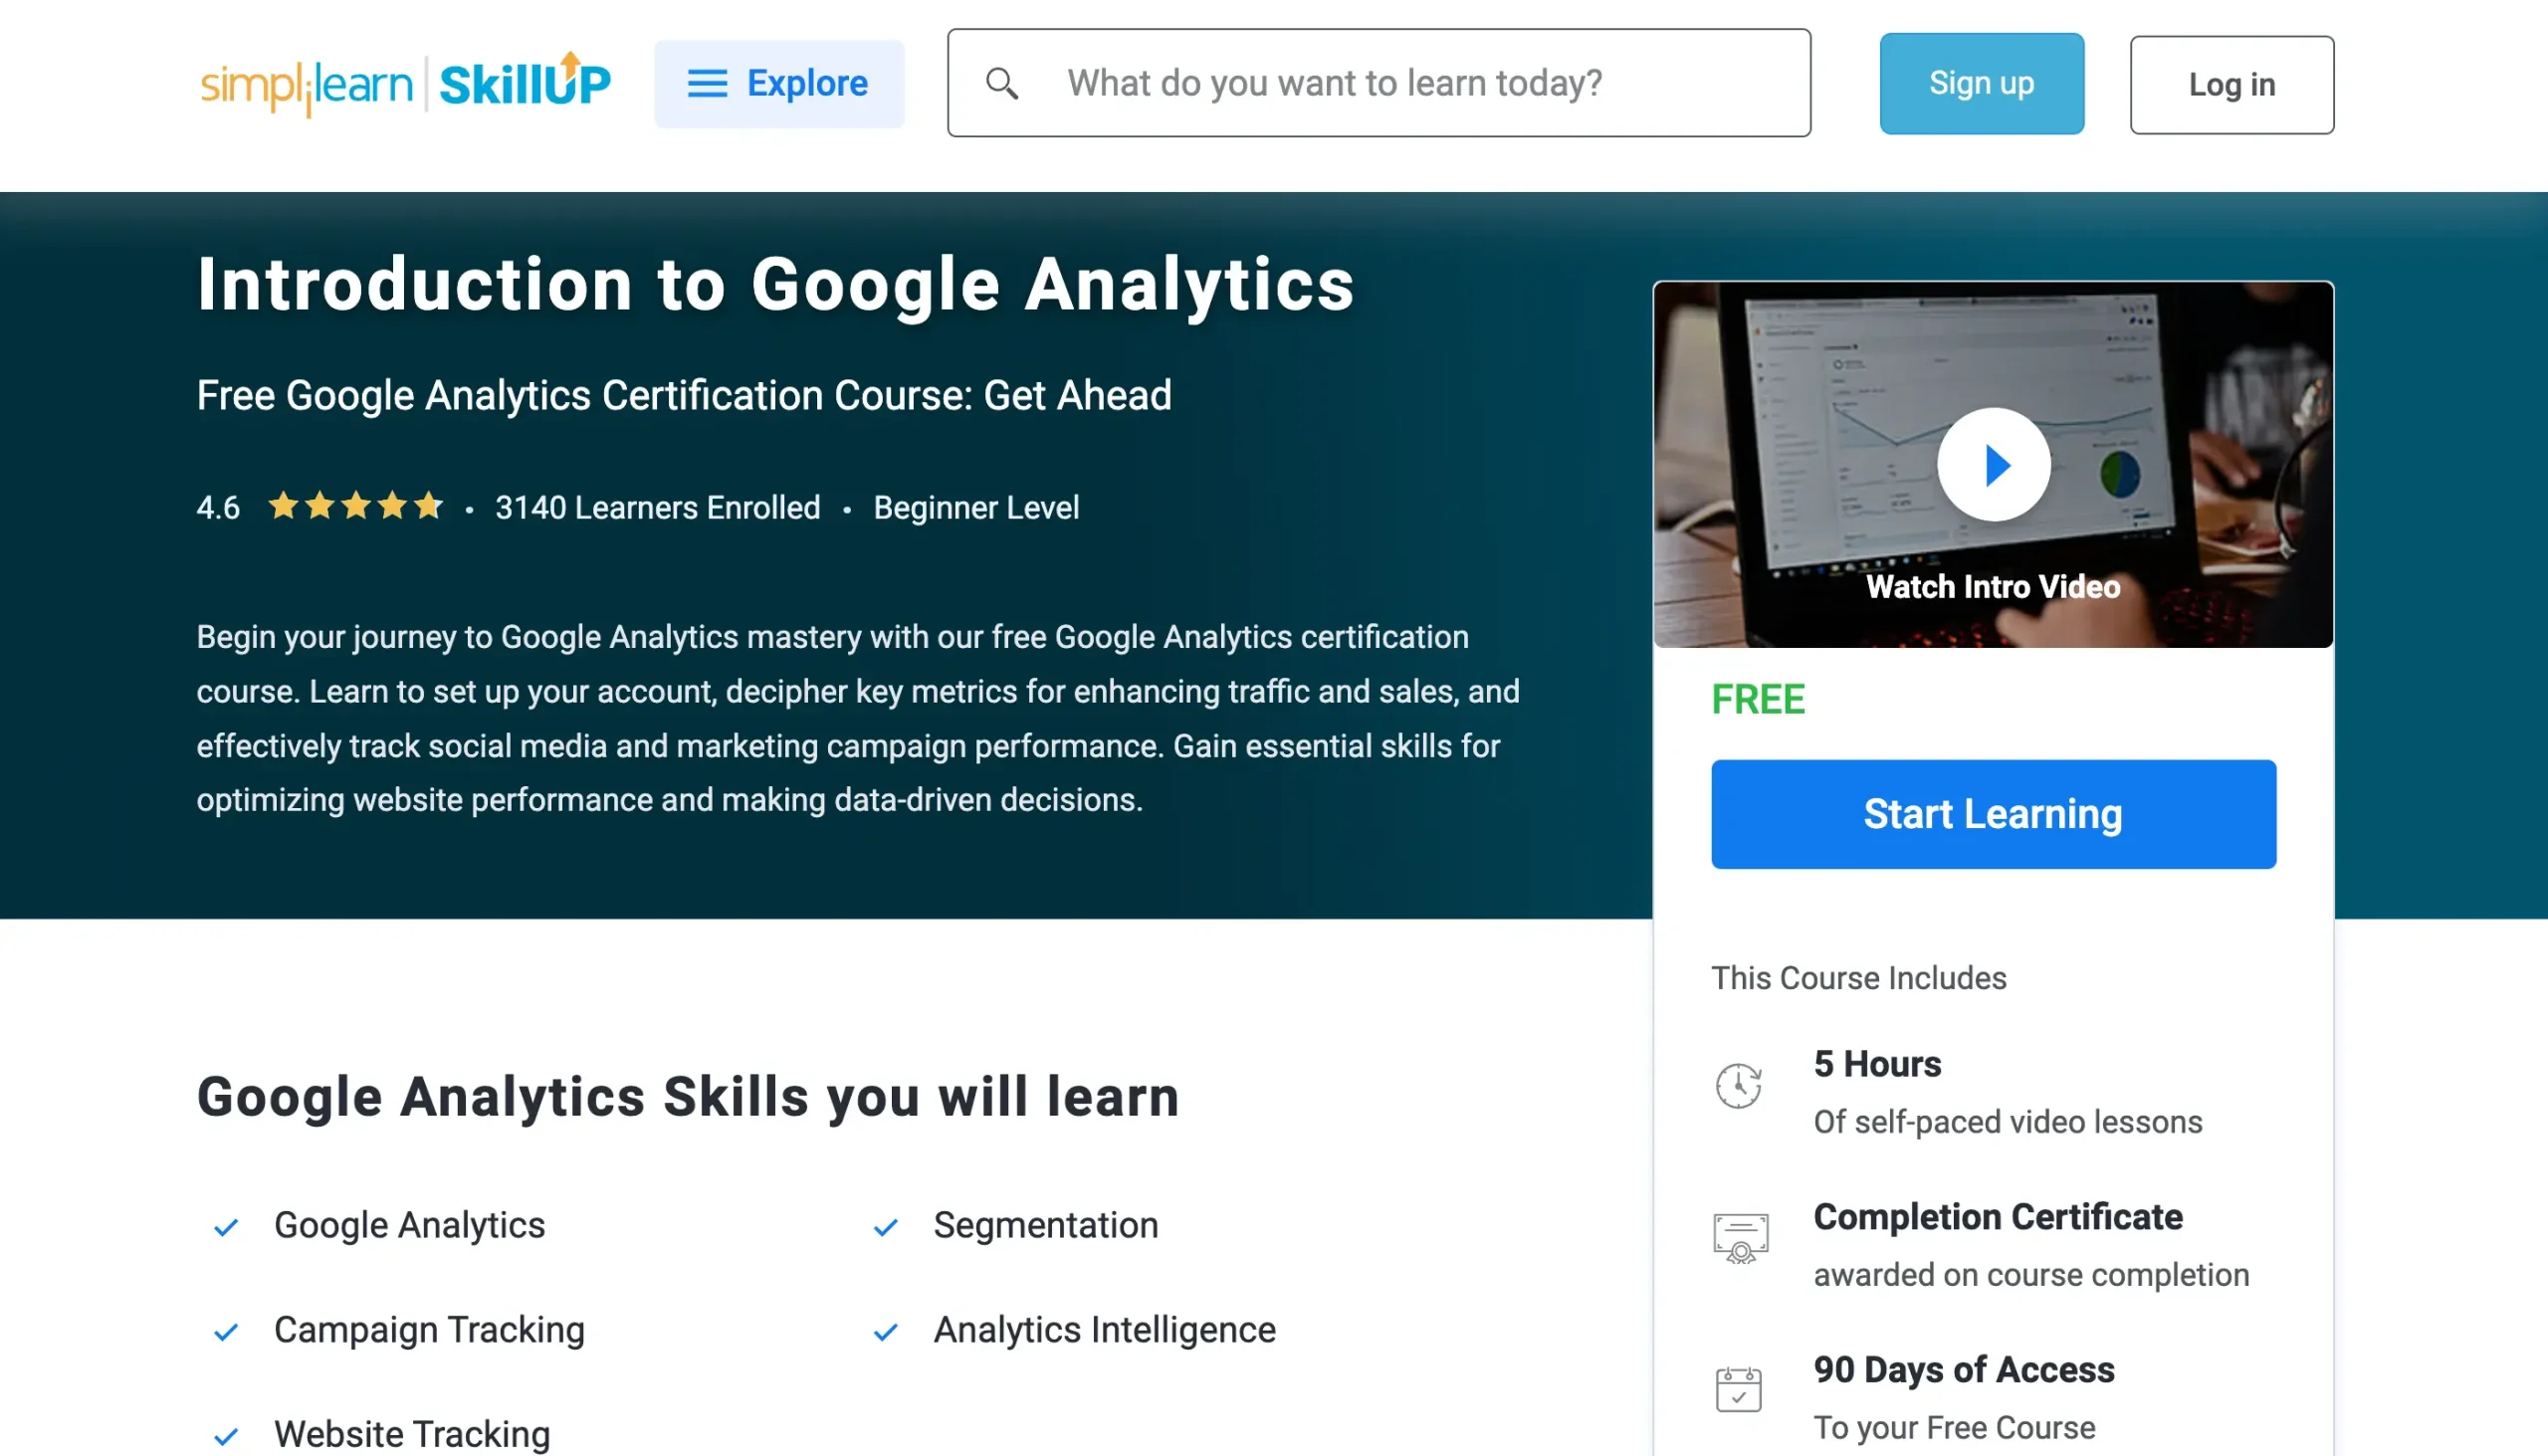
The Introduction to Google Analytics by Simplilearn is a free course for people just starting with Google Analytics.
With this course, you’ll learn how to set up a Google Analytics account and understand the various metrics that contribute to boosting your sales and traffic.
All the lessons are bite-sized to fit them into your schedule. Lessons include:
- Tracking people and goals
- Analyzing marketing effectiveness
- Creating segments
- Advanced table filtering
- Introduction to Google Analytics
- Google Tag Manager
Why enroll in this course?
The course is easy to follow and provides a basic insight into everything from audience segmentation and analytics intelligence to campaign tracking.
It includes many examples, including how to set up Google Tag Manager (a topic not covered in other courses).
It takes 5 hours to complete and comes with a Google Analytics Certification.
6. Google Analytics Certification Training By CXL
- Cost: $299 / mo
- Duration: 25 hours
- Level: Beginner to Advanced
- Certification: Yes
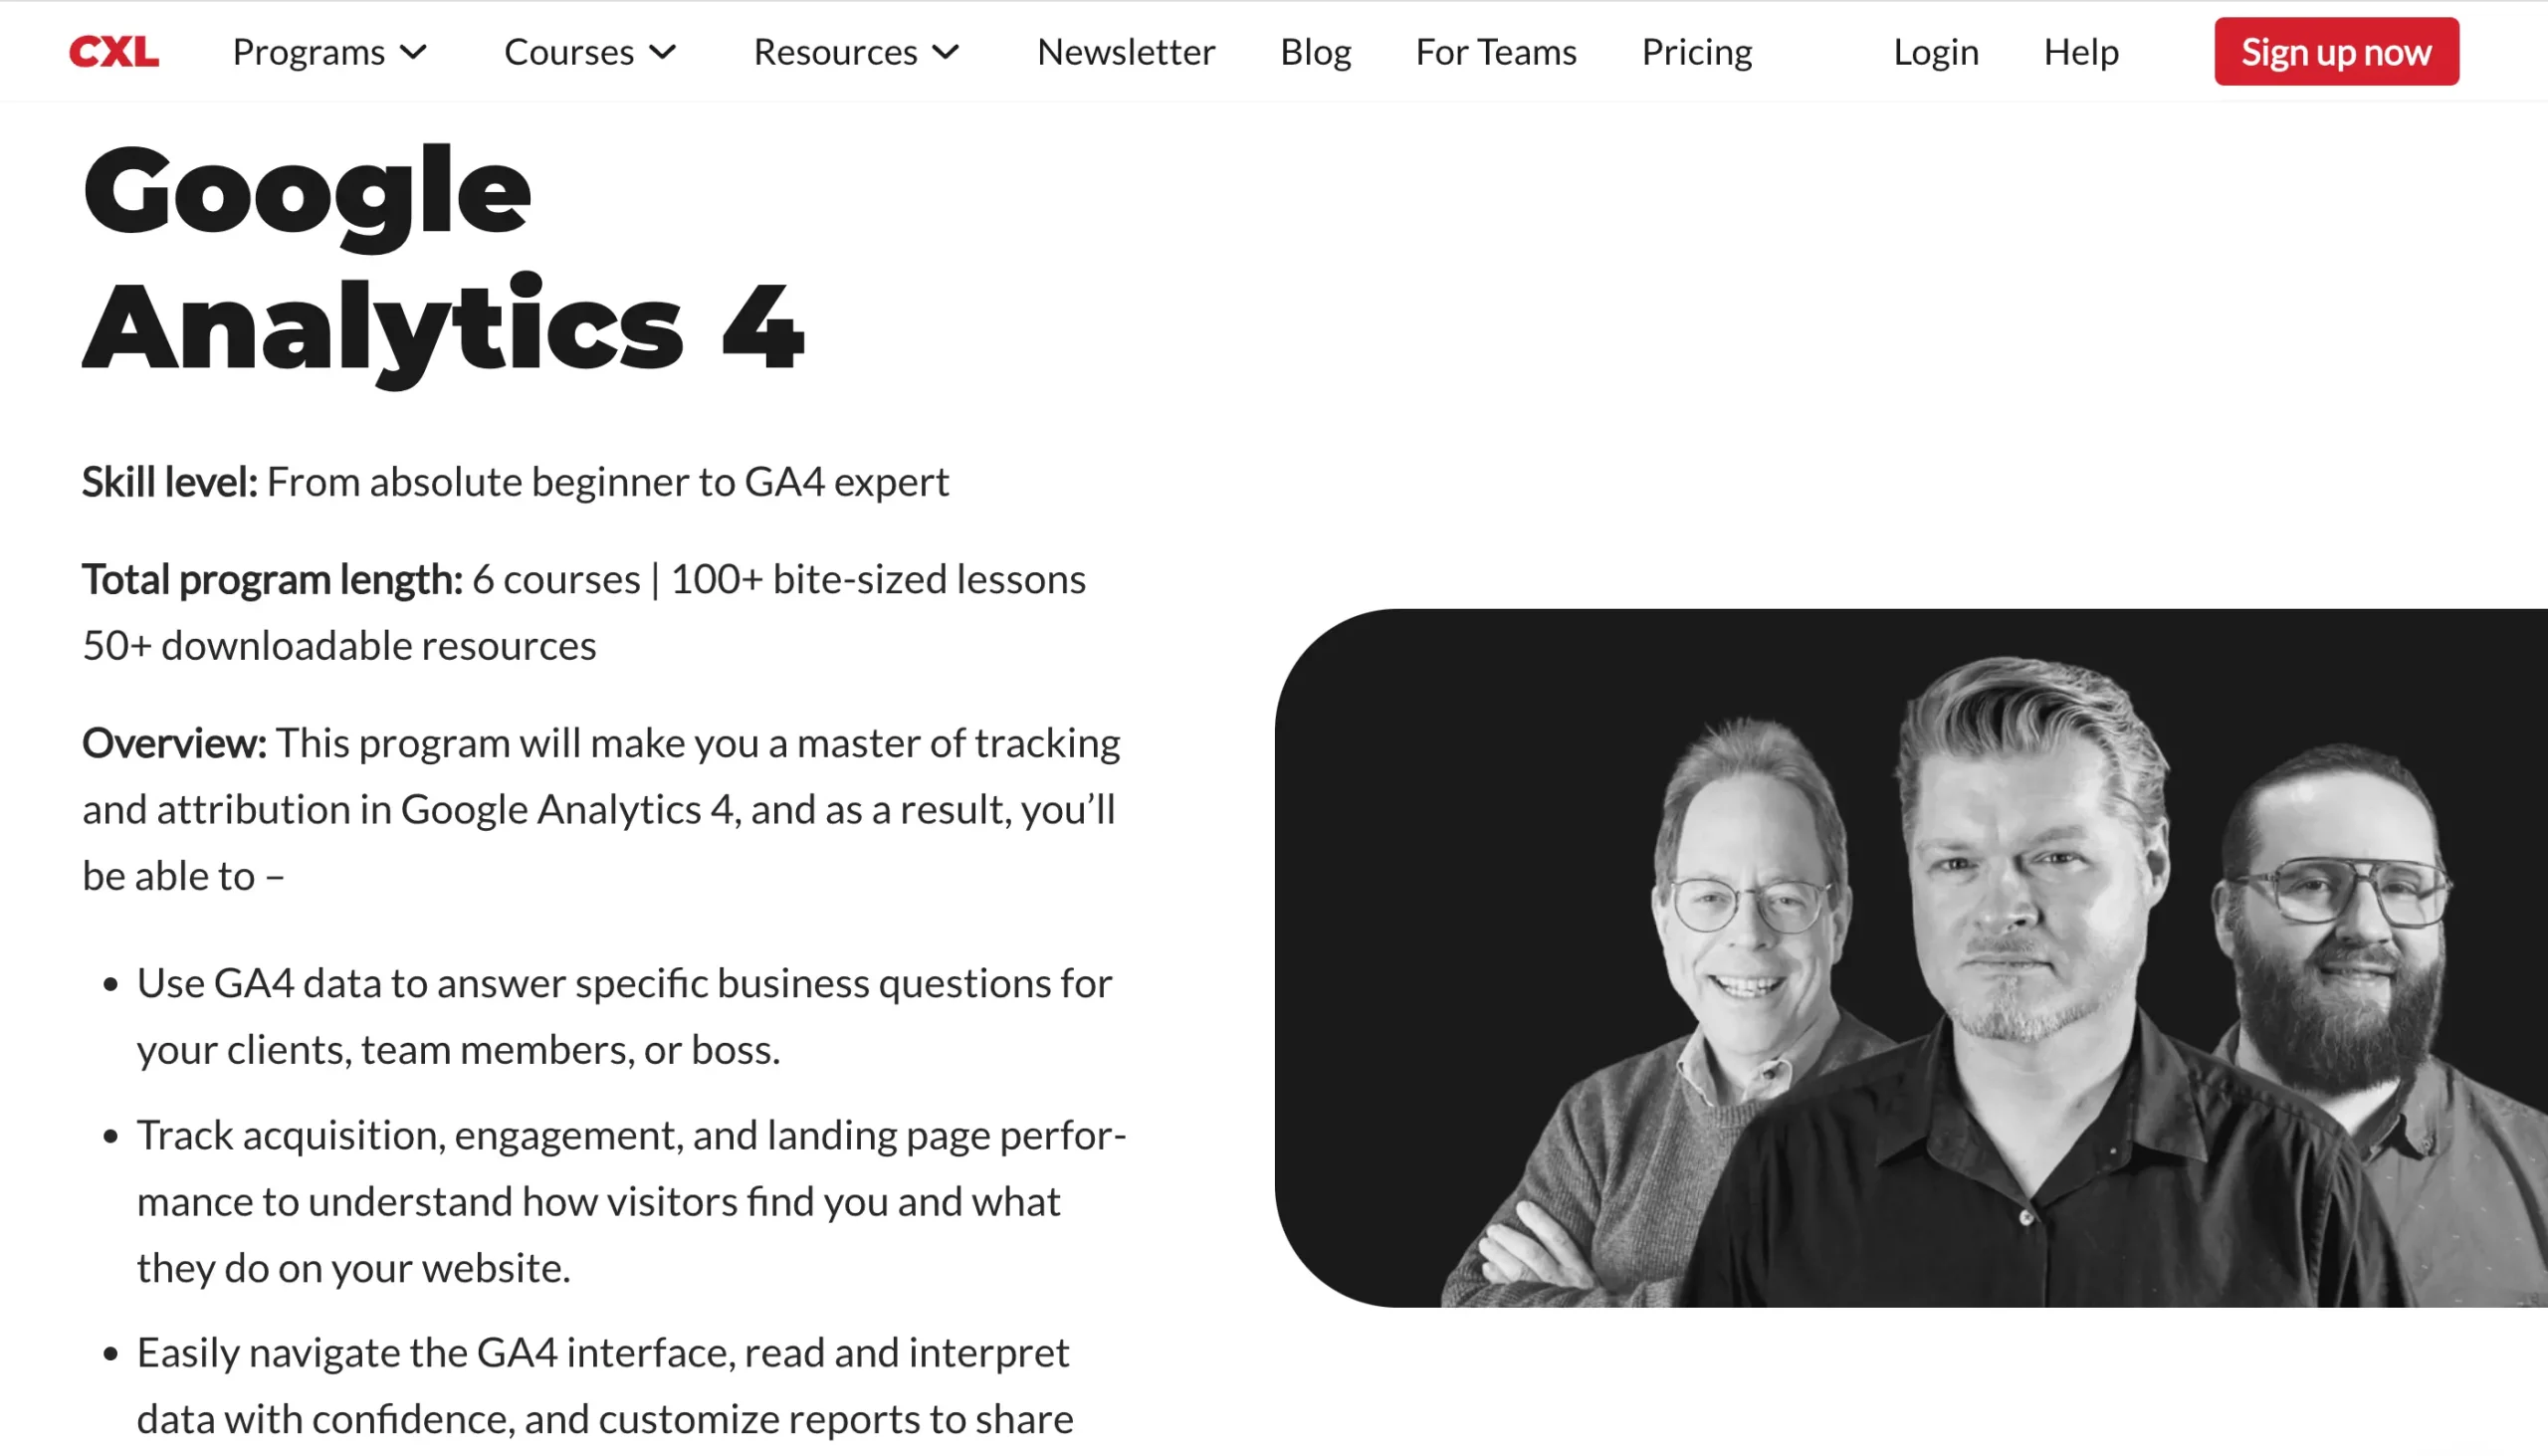
The Google Analytics Certification by CXL is a comprehensive training program that will take you from an absolute beginner to a complete expert.
It includes 6 courses, 100+ lessons, and 50+ downloadable resources to help you make better product, marketing, and strategy decisions.
When you enroll in this training program, you’ll learn how to navigate the Google Analytics interface, read data with confidence, and produce meaningful reports.
You’ll also discover more about who your visitors are and where they come from visiting your website.
The six courses that make this certificate are:
- Preparing for GA4 Implementation
- Google Analytics 4 – For beginners
- Google Analytics 4 – Intermediate
- Google Tag Manager
- GA4 Audit
- Special Topics
Why enroll in this course?
It covers both basic and advanced concepts, and all courses are delivered by experienced professionals.
This is the course to follow if you want to become a Google Analytics expert and earn a recognized industry certification.
7. Google Analytics 4 (GA4) Essential Training By LinkedIn
- Cost: $39.99
- Duration: 1.45 hours
- Level: Beginner
- Certification: Yes
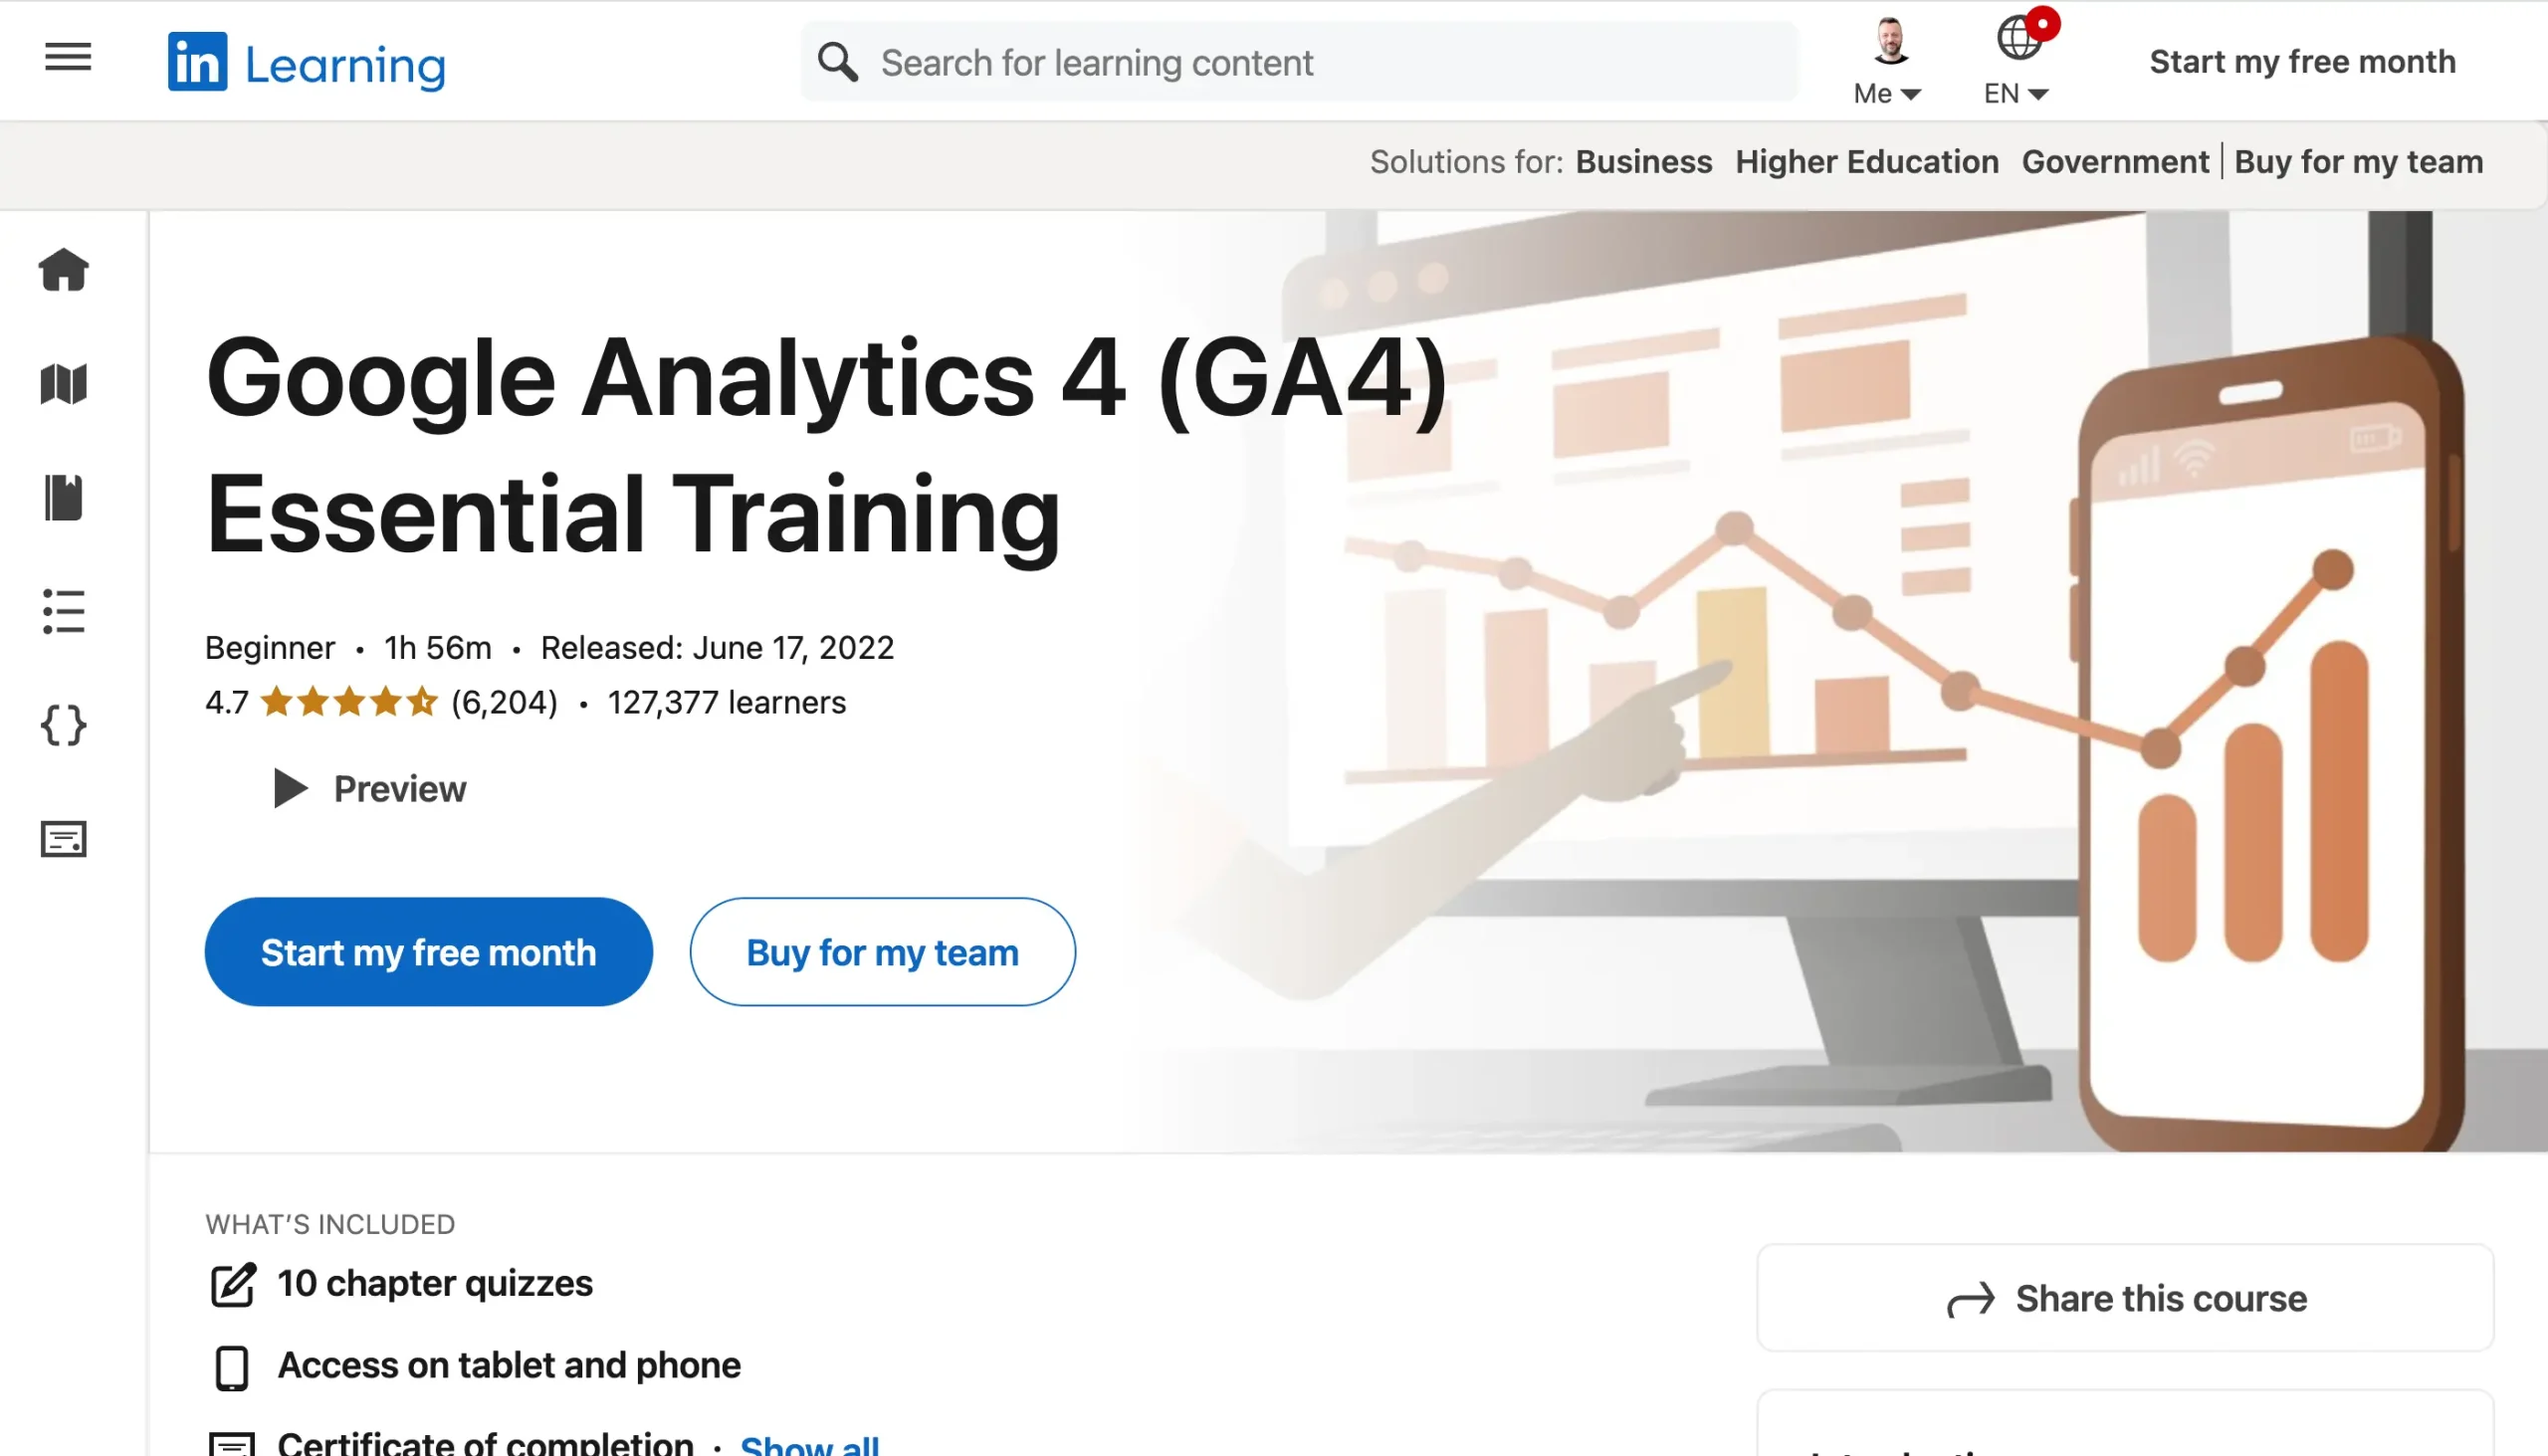
Another option for learning the basics of Google Analytics is the Google Analytics 4 Essential Training course from Corey Koberg.
Corey walks students through the techniques they need to track, analyze, and report on the visitors to their websites or applications.
You’ll learn about how customers engage with your online assets and what you can do to improve your presence online. Aspects of the course include:
- Insights into Google Analytics features and capabilities
- How to use leading AI and analytics tools to understand your audience
- How to use the out-of-the-box functionality of Google Analytics
- What it takes to convert and retain customers
- How to manage user accounts via Google Analytics
Why enroll in this course?
It's a quick course that focuses on what you really need to know when you start working with Google Analytics. All the lessons are straight to the point, without giving details you might not use.
In addition, it is highly rated by LinkedIn Learning students. Over 2,500 students gave it a 4.7/5 star rating.
8. Analytics Essentials By LovesData (Free)
- Cost: Free
- Duration: 1.3 hours
- Level: Beginner
- Certification: No
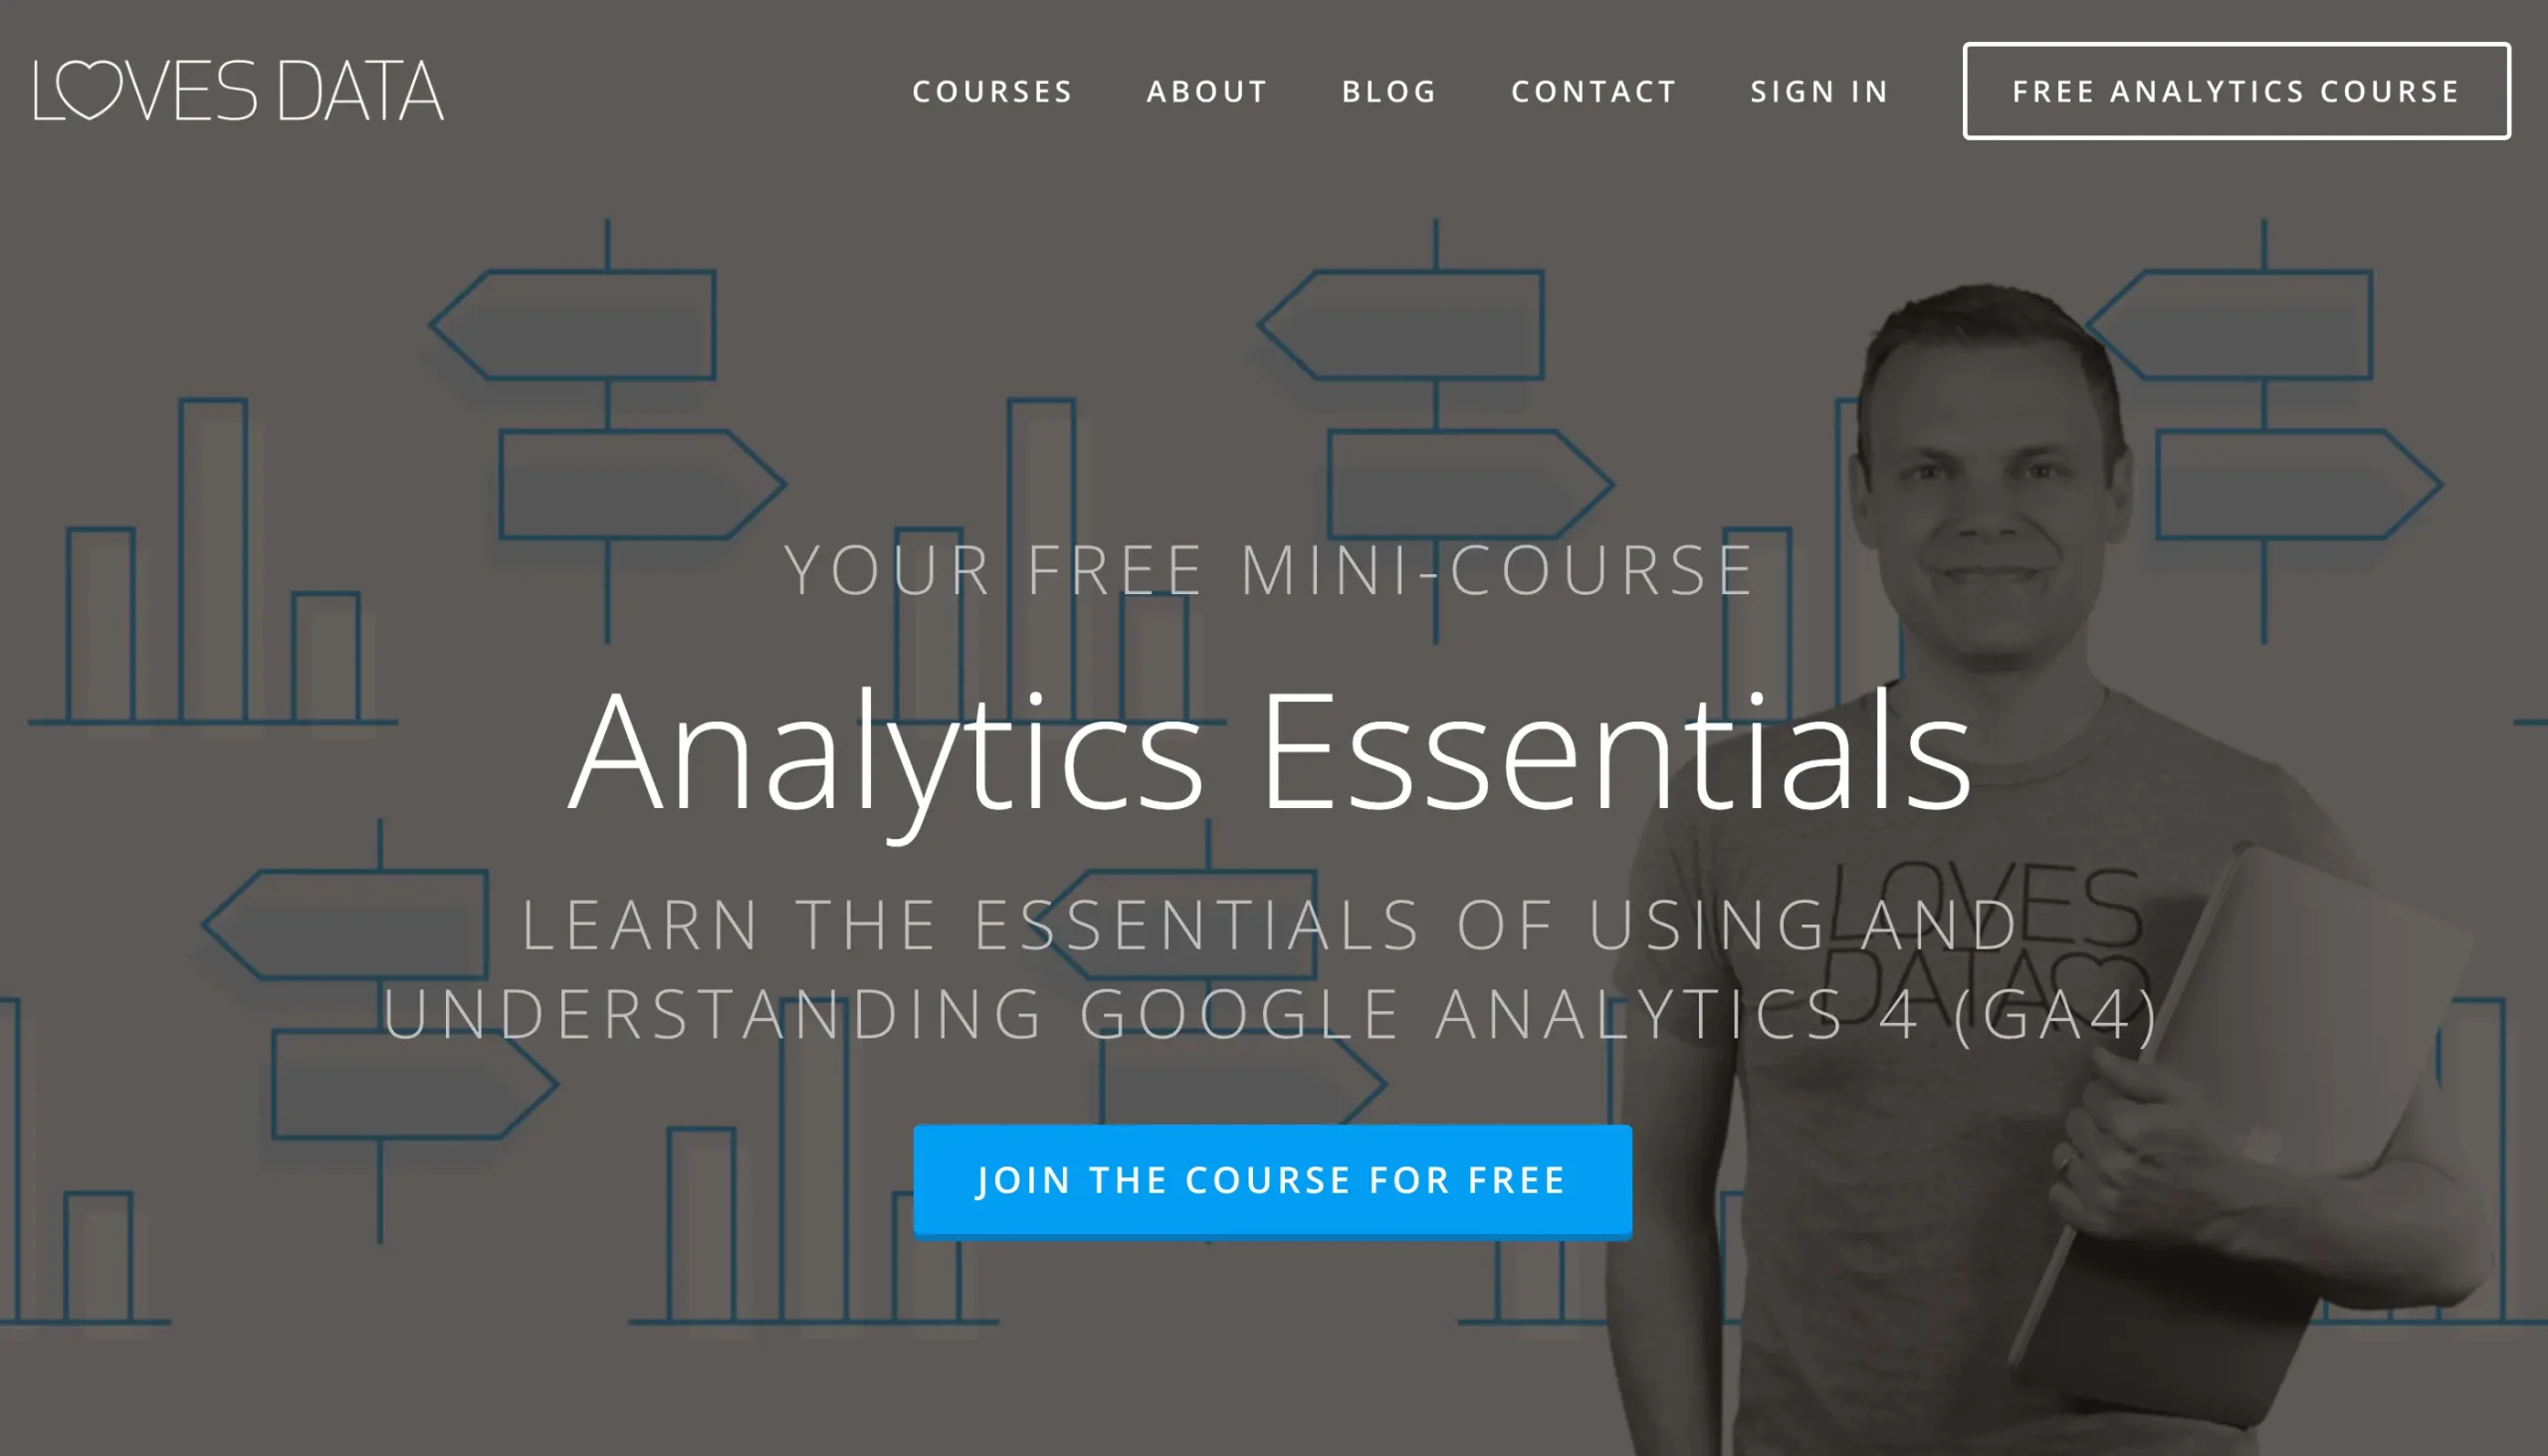
The Analytics Essentials Course By LovesData is a free-to-use resource for Google Analytics training.
After just over an hour of learning, you’ll know how to confidently access and use Google Analytics and its diverse features to manage and evaluate the outcomes of your marketing campaigns.
In this course, you'll learn how to develop practical techniques for using Google Analytics so you can get the most from your data.
It also covers:
- Guidance on Google Analytics terminology and how the features work
- Tips for how to measure all kinds of online marketing strategies
- How to identify opportunities for optimizing your marketing campaigns
- How to use the acquisition reports in Google Analytics
- What it takes to measure and improve conversions in Google Analytics
Why enroll in this course?
Benjamin Mangold is the instructor of this course. He’s been working with Google Analytics for over 14 years and has extensive experience consulting for companies ranging from 3M to Google.
It's a free course that is pleasant to watch. It includes 12 videos to help you master the essentials, with a choice to upgrade to a paid course to continue learning advanced topics.
9. Google Analytics For Business Marketing By Skillshare

- Cost: $39/mo
- Duration: 56 minutes
- Level: Beginner
- Certification: No
The Google Analytics For Business Marketing by Skillshare walks you through getting the most out of your website data.
This online class discusses everything from how to understand your user demographics to how you can build a dashboard for better Google Analytics reporting.
During this course, which lasts a little over 1 hour, you’ll learn:
- How to set custom goals based on visitor behavior
- Tips for using segments and content groups to understand users better
- How to track search terms and campaigns for more insights on traffic sources
- What you can do to understand your data better and turn it into actionable insights
- Where most companies can improve website effectiveness
Why enroll in this course?
The instructor is Joshua George, an experienced Google Analytics Strategist. The course includes 13 lessons and takes just 56 minutes to complete.
By the end of this class, you'll have a solid understanding of how to use Google Analytics to measure website traffic and gain insights into user behavior.
Compare Google Analytics Courses
The table below compares the cost of the most popular Google Analytics online training courses.
| Course | Cost | Duration | Certificate |
|---|---|---|---|
| Manage GA4 Data And Learn To Read Reports By Google | Free | 1 hour | No |
| Google Analytics Course By Reliablesoft | $149 | 4 hours | Yes |
| Google Analytics Certification By Google | Free | 4.5 hours | Yes |
| Google Analytics For Beginners By Udemy | $89.99 | 1.5 hours | Yes |
| Introduction to Google Analytics By Simplilearn | Free | 5 hours | Yes |
| Google Analytics Certification Training By CXL | $299 | 25 hours | Yes |
| Google Analytics 4 (GA4) Essential Training By LinkedIn | $39 | 1.45 hours | Yes |
| Analytics Essentials By LovesData | Free | 1.3 hours | No |
| Google Analytics For Business Marketing By Skillshare | $39 | 56 minutes | No |
Who Should Take a Google Analytics Course?
There are plenty of people who can benefit from a Google Analytics course. The most obvious individual is usually a digital marketing specialist – someone spending a lot of time and effort making a company’s advertising efforts more successful.
However, you can also benefit from a Google Analytics course if you’re an SEO expert, brand manager, or business owner trying to boost your position online.
Here are some of the best reasons to take a Google Analytics course:
Enhance your competency: The biggest benefit of a Google Analytics certification is improving your competency in using the tool. In these courses, you’ll learn about the intricacies of Analytics and how to make the most of the various reports and features.
Gain an edge on the competition: Though many people might fail to see the benefits of a Google certification, some profound benefits exist in outshining the competition. When you complete the program, you can show you’re certified on your resume.
Stay ahead of the curve: Becoming Google analytics certified ensures you know everything there is to know about the platform, even as Google’s algorithms continue to evolve. You can always update your certification over time.
Become a digital marketer: Once you become an expert on Google Analytics, you can pursue a digital marketing course, obtain a digital marketing certification, and start a successful career in digital marketing.
Our Course Review Process
We've reviewed the most popular Google Analytics training providers to help you find a suitable course for your needs. The courses were selected based on content quality, academy reputation, and cost.
All courses are perfectly suited for beginners to Google Analytics. We added free and paid courses covering the latest version, Google Analytics 4.
Getting Certified With Google Analytics
As online marketing continues to evolve, Google Analytics is one of the most valuable tools for boosting your online presence.
Every day, countless business owners, analysts, consultants, and marketing professionals use Google Analytics to understand better their target audience and the journey they take to purchase.
Through Google Analytics certification, you can develop a more profound knowledge of the various features and functionalities available from Google’s dedicated Analytics software.
At the same time, you can build your reputation as a Google Analytics expert. This is ideal if you’re hoping to attract more clients for your advertising agency or improve your position as a thought leader.
